In the study of corrective structures, proportion provides clarity amidst complexity. While motive waves expand through geometric multiplication, corrective counter-trends adhere to strict symmetry and balance. In my analytical practice, the relationship between Wave C and Wave A is the single most reliable metric for timing the conclusion of three-wave corrective pullbacks. In orthodox zigzag patterns (5-3-5), Wave C most frequently achieves exact mathematical equality (1.000) with Wave A. Understanding when and why this 1:1 equality ratio manifests—and when it expands to 1.618—is crucial for mapping corrective terminations with pinpoint accuracy.
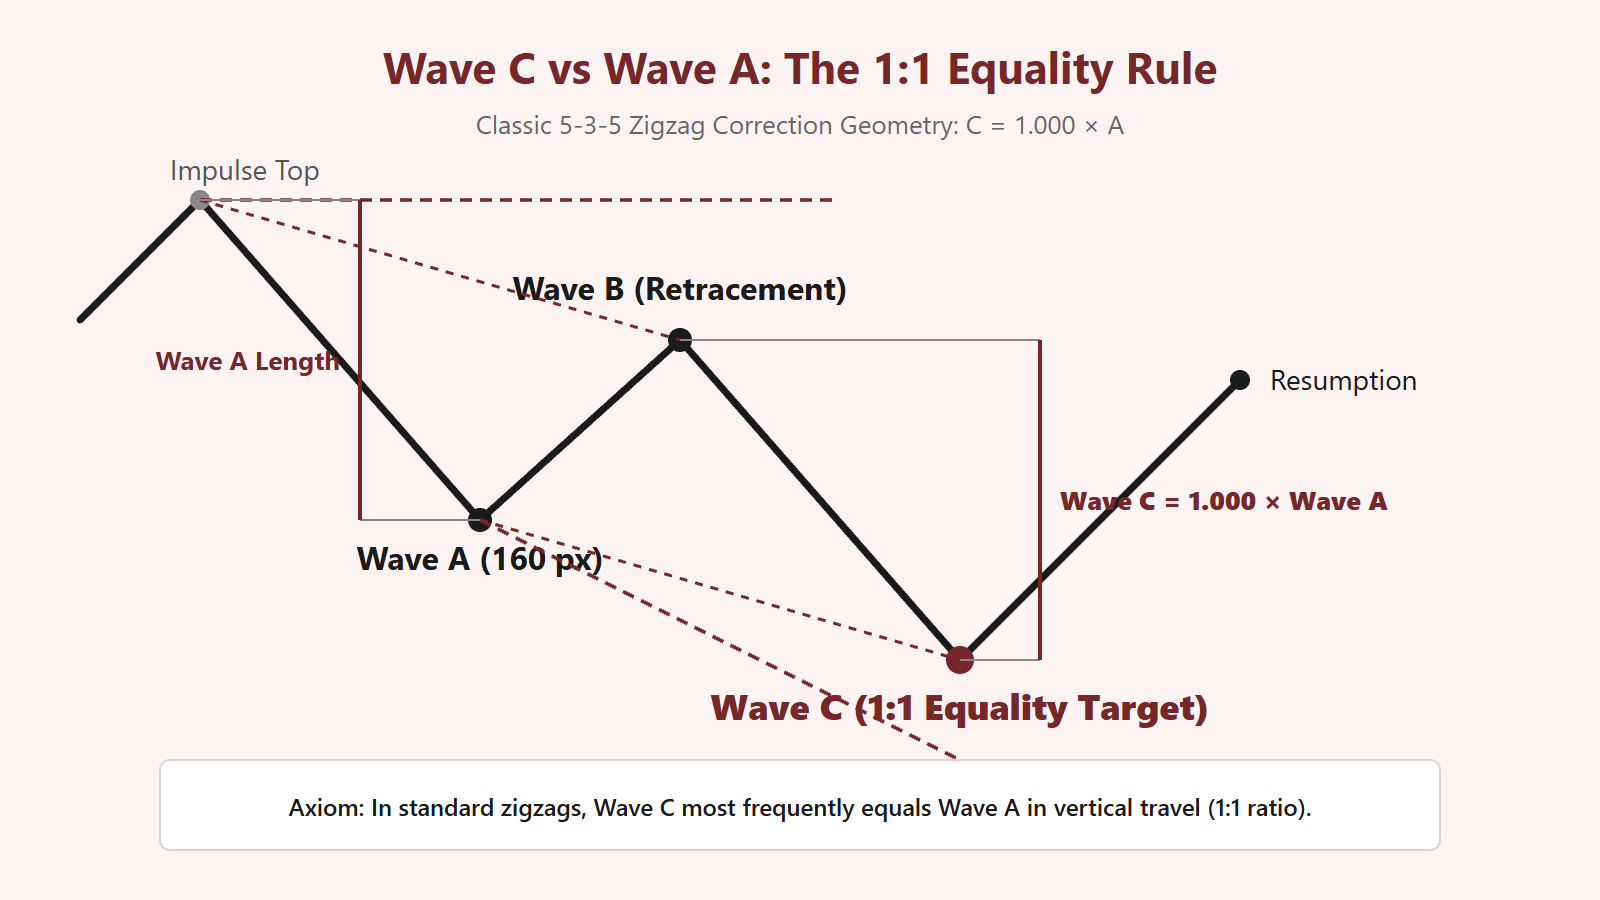
The 1:1 Equality Guideline in Zigzag Patterns
A zigzag is a sharp, three-wave corrective structure designated as 5-3-5 because Wave A contains five motive sub-waves, Wave B contains three corrective sub-waves, and Wave C unfolds as a final five-wave motive impulse. Because Wave A and Wave C are both motive waves unfolding in the same direction, they naturally exhibit proportional harmony.
The standard projection formula for the termination of Wave C in a zigzag is:
$$ ext{Target}( ext{Wave C}) = ext{Price}( ext{Wave B High/Low}) – ( ext{Length of Wave A} imes 1.000)$$
This 1:1 equality relationship produces an aesthetically balanced, symmetrical geometric form. When Wave C equals Wave A in vertical price travel, the corrective cycle has consumed an equal amount of structural force on both wings of the consolidation. Furthermore, this equality point very frequently coincides with the 0.500 or 0.618 Fibonacci retracement level of the preceding larger-degree motive impulse, creating a robust dual-ratio confluence zone.
Parallel Channel Validation
To mathematically confirm the progression of a 1:1 zigzag, I employ Ralph Nelson Elliott’s parallel channeling technique:
- Connect the origin of Wave A with the terminus of Wave B to create an upper baseline.
- Draw a parallel trendline originating from the terminus of Wave A.
- In an orthodox zigzag, Wave C will terminate precisely when price touches this lower parallel channel line at the exact moment the 1:1 price equality calculation is fulfilled.
If Wave C breaks out through the lower channel line with surging volume and impulsive acceleration, it signals that the correction is not terminating at equality, but is expanding into an elongated or multi-degree corrective state.
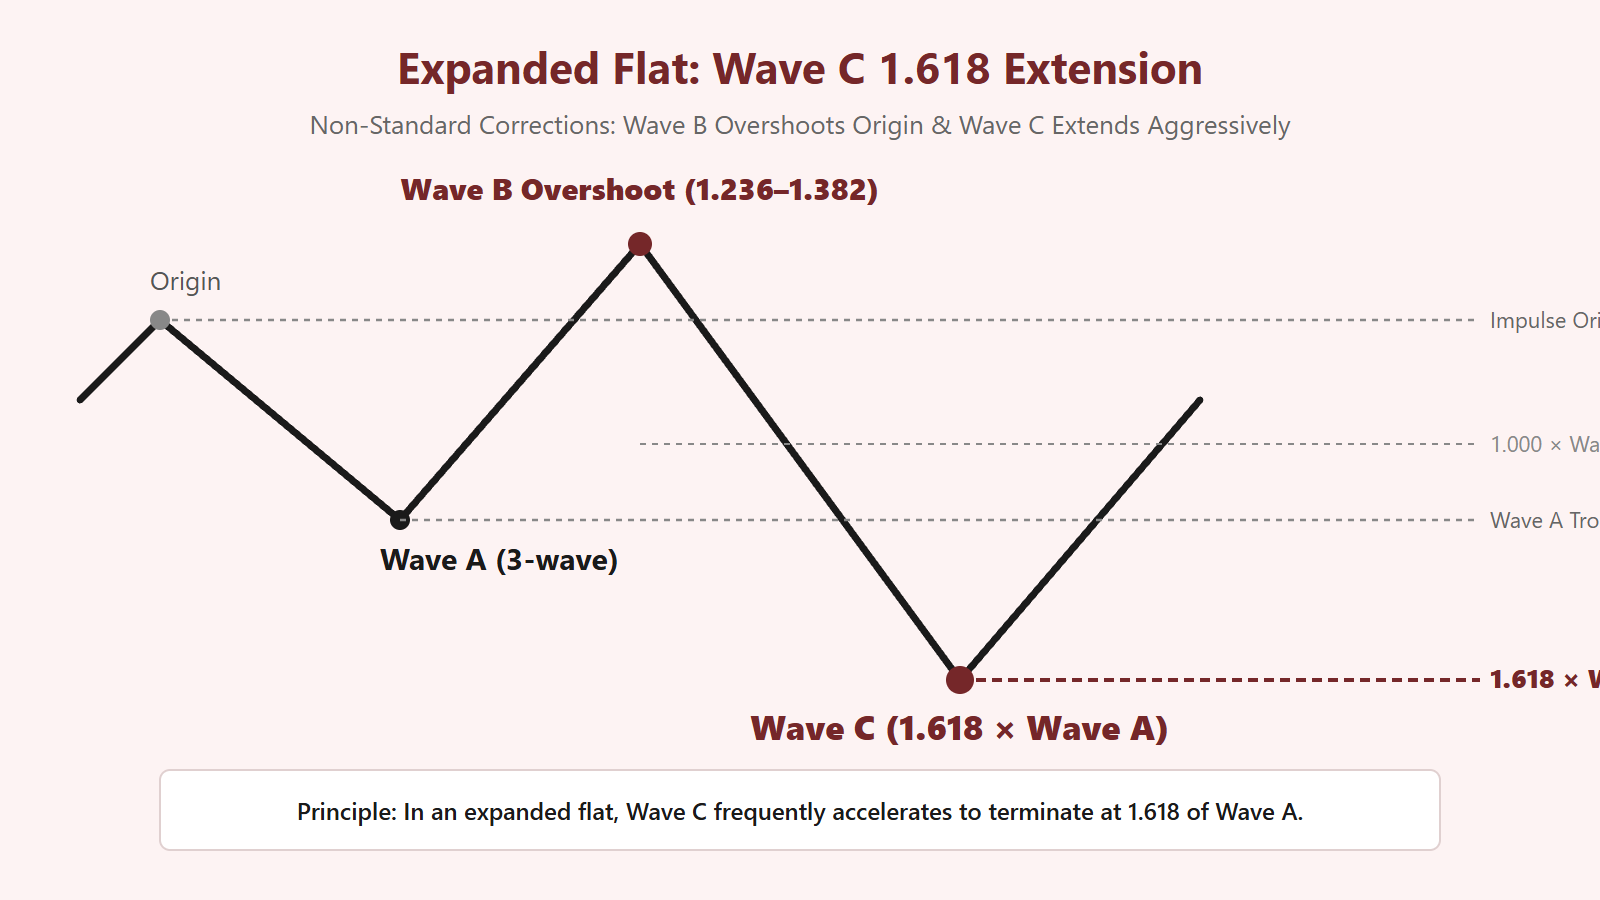
Expanded Flats: The 1.618 Wave C Extension
While the 1:1 ratio dominates zigzags, the geometry shifts dramatically when analyzing flat corrections (3-3-5). In a flat, Wave A is only a three-wave corrective structure, reflecting intense underlying pressure from the larger trend. In an expanded flat, this pressure causes Wave B to retrace between 1.236 and 1.382 of Wave A, piercing beyond the origin of the correction.
This aggressive overshoot sets up an explosive terminal phase for Wave C. Because the market was stretched out of equilibrium during Wave B, Wave C must travel significantly farther to complete the three-phase shakeout. In an expanded flat:
$$ ext{Length}( ext{Wave C}) = ext{Length}( ext{Wave A}) imes 1.618$$
When calculating this target, the 1.618 multiplier of Wave A is projected downward from the extreme peak of Wave B. In extreme liquidity expansions, Wave C can even reach 2.618 of Wave A, thoroughly flushing out market participants before the dominant trend reasserts itself.
Alternative Proportional Ratios Between C and A
Across extensive structural observation, I classify the relative proportions between Wave C and Wave A into distinct mathematical probability tiers:
| Ratio (C : A) | Corrective Structure | Structural Significance |
|---|---|---|
| 0.618 | Running Flat / Running Zigzag | Wave C truncates early; indicates extreme strength in the direction of the larger trend. |
| 1.000 | Standard Zigzag / Regular Flat | Orthodox baseline; maximum geometric symmetry and balance. |
| 1.272 | Mildly Expanded Flat | Inverse Golden Ratio extension; common when Wave B mildly exceeds Wave A origin. |
| 1.618 | Severe Expanded Flat / Elongated Zigzag | Motive thrust in Wave C; exhausts all counter-trend liquidity before reversal. |
Practical Execution and Invalidation Logic
When tracking an active Wave C, I wait for the price to enter the target zone defined by the 1:1 (or 1.618) ratio and inspect its internal sub-wave structure. Because Wave C is always an impulse or ending diagonal, it must display five complete sub-waves.
If price touches the 1:1 equality line and displays only three sub-waves, the structure is incomplete; the pause is merely sub-wave 4 of C, and one more thrust is required to fulfill the five-wave requirement. Conversely, if price decisively breaks through the 1.618 boundary and maintains impulsive momentum without five-wave termination characteristics, the entire three-wave corrective thesis is invalidated, indicating that the move is an impulsive trend reversal of larger degree.


Leave a Reply