The fifth wave of an impulse sequence is a masterclass in psychological deception. To the untrained eye, Wave 5 appears as an era of boundless optimism: public sentiment is euphoric, headlines proclaim perpetual growth, and conventional indicators flash pristine trend signals. Yet to a structural analyst, Wave 5 is an environment of terminal decay. Beneath the nominal higher price highs, underlying momentum is decelerating, internal participation is collapsing, and the geometric structure is approaching mathematical exhaustion. Predicting market tops is not a matter of guessing; it is a discipline of measuring Wave 5 exhaustion through symmetry, channeling, and momentum divergence.
The Psychology of the Terminal Fifth Wave
Every wave within a motive sequence carries a distinct psychological personality. Wave 1 is born from disbelief; Wave 3 is powered by institutional recognition; Wave 5 is fueled purely by retail euphoria and emotional late-comers. During Wave 5, market participants who missed the explosive expansion of Wave 3 finally succumb to the fear of missing out, throwing their capital into the market at the worst possible structural coordinate.
Because the broader market is fully invested, there is no remaining sideline capital to sustain the advance. The price pushes upward not through genuine institutional buying, but through sheer momentum inertia. In my analysis, I treat Wave 5 not as an opportunity for trend continuation, but as an advanced warning system that the entire multi-degree motive cycle is preparing to terminate.
The Rule of Equality: Symmetrical Price Targets
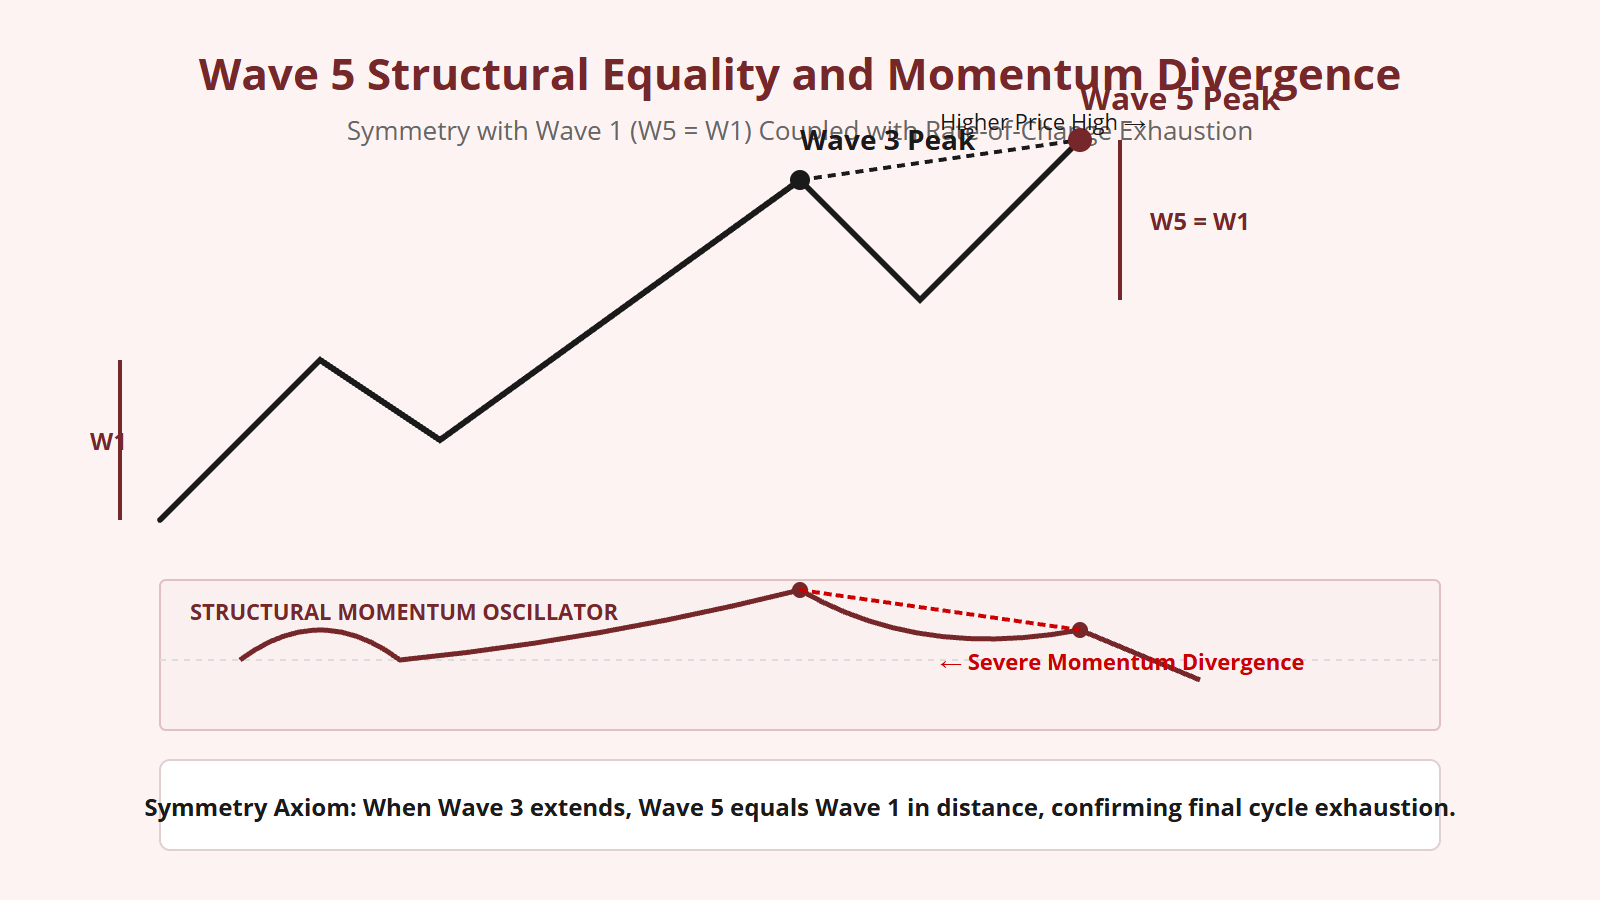
One of the most reliable mathematical guidelines in all of wave mechanics is the Rule of Equality. The guideline states that when Wave 3 is the extended wave (as it is in the vast majority of impulse sequences), Wave 5 tends toward mathematical symmetry with Wave 1.
To calculate the primary exhaustion target for Wave 5, I apply the following formulas:
- 1.000 Equality Target (Primary): Measure the exact vertical distance covered by Wave 1 (from Origin 0 to the Wave 1 peak). Project that exact distance upward from the verified termination trough of Wave 4:
$$ ext{Wave 5 Target} = ext{Wave 4 Low} + ( ext{Length of Wave 1})$$ - 0.618 Compressed Target (Secondary): If Wave 3 was exceptionally violent (surging beyond the 2.618 extension), Wave 5 frequently suffers structural compression, terminating at precisely 61.8% of Wave 1:
$$ ext{Wave 5 Target} = ext{Wave 4 Low} + ( ext{Length of Wave 1} imes 0.618)$$ - 0.382 Minimum Target: In conditions of severe momentum depletion, Wave 5 reaches only 38.2% of Wave 1 before terminating.
When price reaches the 1.000 equality coordinate, the geometric structure achieves mathematical balance. The beginning of the impulse mirrors the conclusion of the impulse, creating an aesthetically complete five-wave motive cycle.
Channeling Techniques for Pinpointing Wave 5 Apex
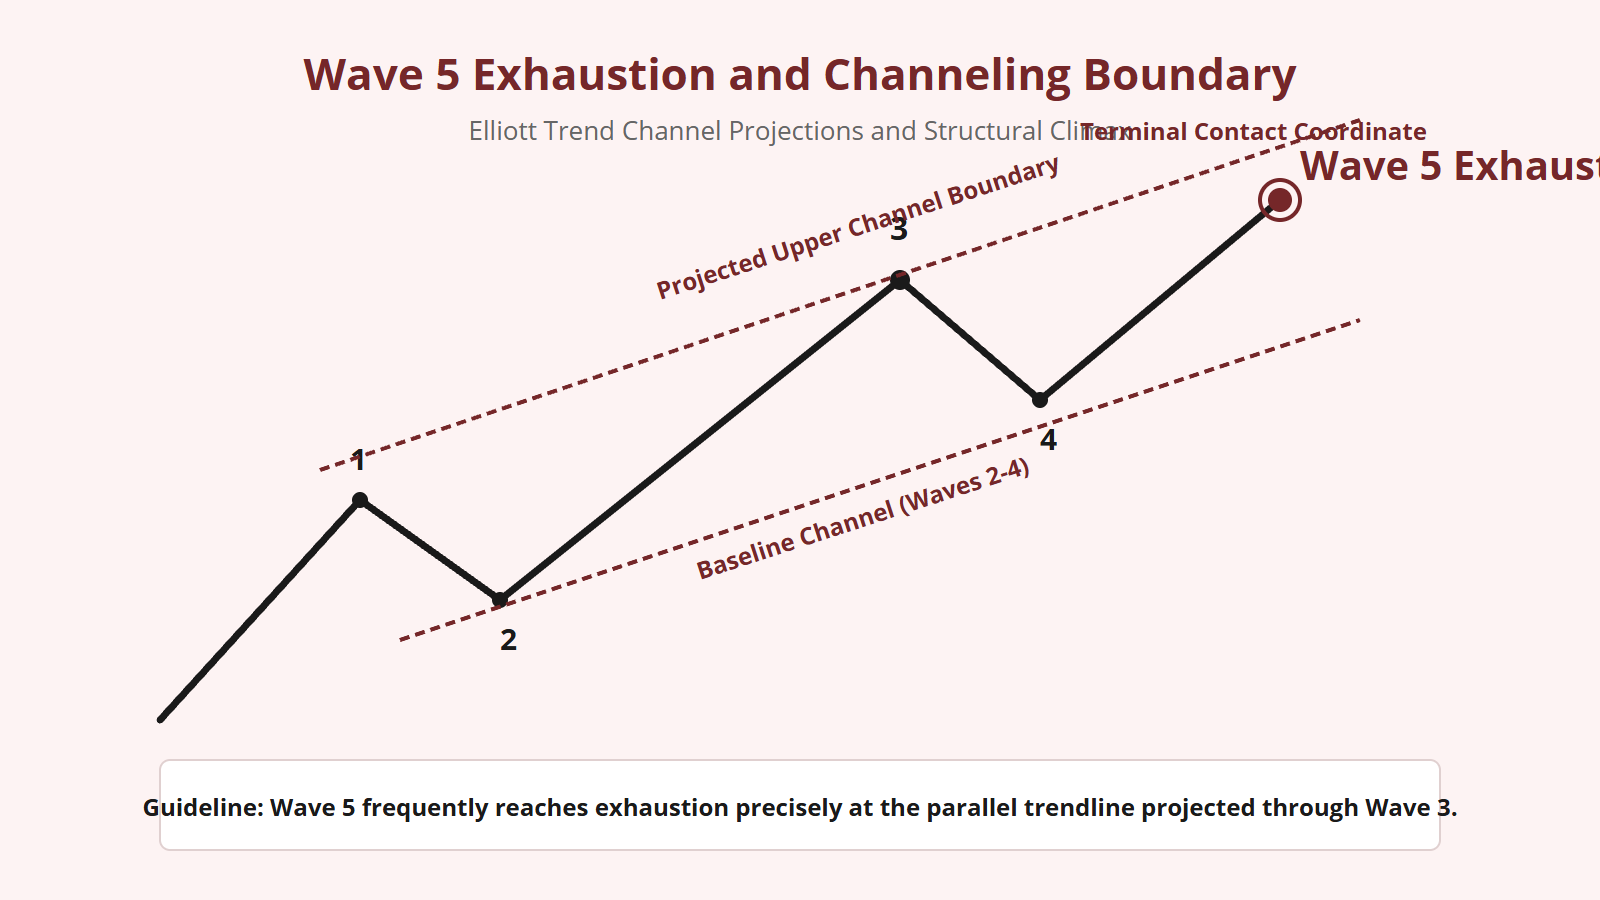
R.N. Elliott developed a brilliant geometric channeling technique to project the exact price and time coordinate where Wave 5 will exhaust its trajectory. To construct an Elliott Trend Channel:
- Wait for Wave 4 to complete its corrective pattern and establish a definitive pivot low.
- Draw a baseline trendline connecting the terminal low of Wave 2 and the terminal low of Wave 4.
- Draw a parallel trendline projected through the extreme peak of Wave 3. (If Wave 3 was unusually steep, draw a parallel line projected through the peak of Wave 1 instead).
The upper parallel channel line acts as a dynamic geometric ceiling. Wave 5 will systematically advance toward this upper boundary line. When Wave 5 touches or slightly pierces this upper trendline at the exact price coordinate where the Rule of Equality is satisfied, structural exhaustion is mathematically imminent.
Occasionally, an emotional blow-off creates a temporary throw-over—where price spikes briefly above the upper channel line for a few sessions. When a throw-over occurs and is immediately followed by a sharp collapse back inside the channel, it confirms that Wave 5 has terminated in a definitive buying climax.
Detecting Momentum Divergence and Ending Diagonals
Price geometry must always be validated by rate-of-change momentum. As Wave 5 pushes to a nominal new high above the peak of Wave 3, a structural analyst must cross-reference momentum oscillators (such as the RSI or MACD).
In a healthy trend, higher price highs are confirmed by higher momentum highs. In Wave 5, the exact opposite occurs: price prints a new high, but momentum registers a significantly lower high. This phenomenon—Severe Bearish Momentum Divergence—proves that the velocity of the advance has collapsed, indicating that buyers are exhausted.
Furthermore, Wave 5 frequently adopts the form of an Ending Diagonal (3-3-3-3-3). In an ending diagonal, sub-waves overlap, volume dries up, and price wedges into a narrow apex. An ending diagonal in the Wave 5 position is the most definitive, high-confidence signature of a major market top in the entire Elliott Wave system.
Execution Protocol: Confirming the Cycle Top
To objectively confirm that a market top is established and avoid guessing prematurely, follow this execution protocol:
- Verify Five Sub-Waves: Ensure that Wave 5 has completed all five internal subdivisions [i]-[ii]-[iii]-[iv]-[v]. Never assume Wave 5 is complete while it is still in sub-wave [iii] or [iv].
- Check Confluence: Confirm that the price coordinate aligns with the Rule of Equality ($W5 = W1$) and intersects the upper Elliott trend channel.
- Wait for the Reversal Trigger: A cycle top is not confirmed until price breaks below the internal sub-wave [iv] low of Wave 5. Once sub-wave [iv] is violated with impulsive velocity, the top is mathematically sealed.
By relying on structural mathematics rather than emotional sentiment, you can stand calm at the pinnacle of public euphoria, identify the precise geometric exhaustion of Wave 5, and prepare for the inevitable multi-wave corrective cycle that follows.


Leave a Reply