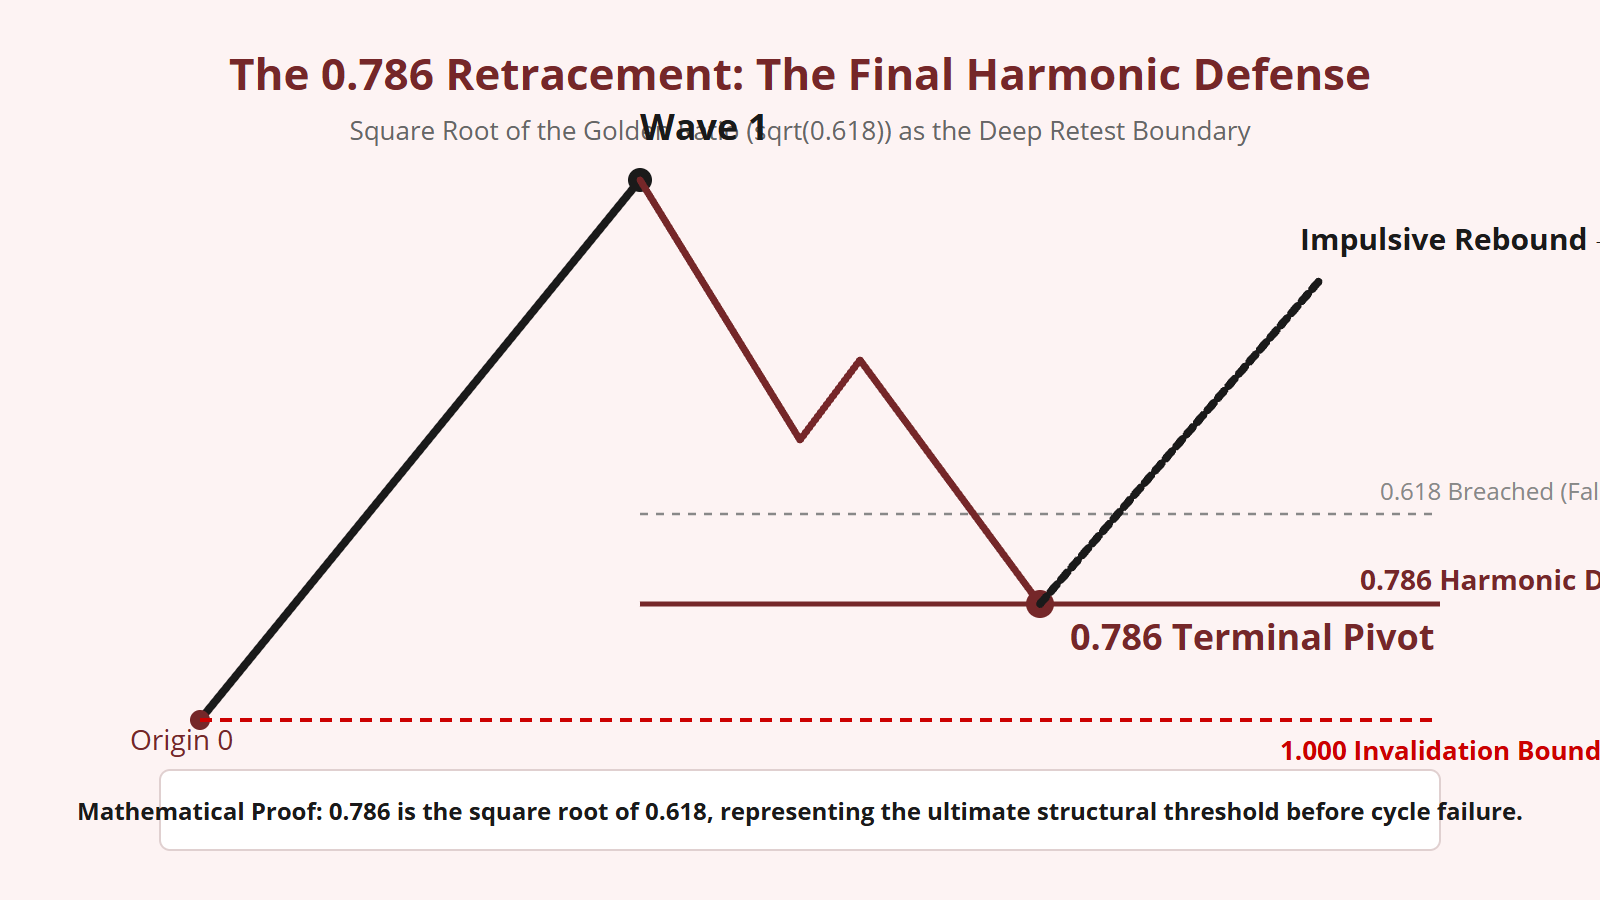
In standard classical charting, many analysts abandon a trend hypothesis the moment price retraces beyond the 61.8% Golden Ratio, assuming that a breakdown past 0.618 confirms a complete trend failure. In structural market geometry, this assumption is dangerously premature. There exists a vital, secondary harmonic threshold that serves as the final line of defense before absolute structural invalidation: the 0.786 Fibonacci Retracement Level. Derived directly as the square root of the Golden Ratio, 0.786 governs deep liquidity sweeps, high-volatility retests, and corrections following leading diagonals. Mastering the 0.786 ratio allows an analyst to maintain structural composure when conventional traders are panicking.
The Mathematical Derivation of 0.786
The 0.786 ratio is often misunderstood by casual chartists as an arbitrary number inserted into charting software. In truth, 0.786 is an essential mathematical derivative of the Golden Section.
Specifically, 0.786 is the square root of the Golden Ratio (0.618):
$$\sqrt{0.6180339887…} \approx 0.786151377… \approx 0.786$$
Because it represents the geometric mean between the Golden Ratio ($0.618$) and unity ($1.000$), 0.786 occupies a unique mathematical position in harmonic analysis. It is also the fourth root of the inverse Golden Ratio ($1 / \Phi^2$):
$$\sqrt[4]{0.382} \approx 0.786$$
In physical dynamics, when a compressed spring or elastic system is released and then forced backward past its equilibrium point, it frequently experiences a secondary harmonic deceleration at the square-root boundary ($\sqrt{\Phi}$) before finding structural support. In financial markets, 0.786 represents the mathematical threshold of maximum allowable elastic stretch.
The Function of 0.786: The Deep Retest
Why do markets retrace all the way to 78.6%? Why doesn’t every correction politely halt at 0.618?
Deep retracements occur primarily in two market environments:
- Low-Liquidity or High-Volatility Regimes: In volatile or thinly traded markets, aggressive participants intentionally push price past obvious support levels (like 0.500 and 0.618) to trigger automated stop-loss orders. This liquidity cascade drives price down to the 0.786 coordinate, where institutional block orders absorb the selling.
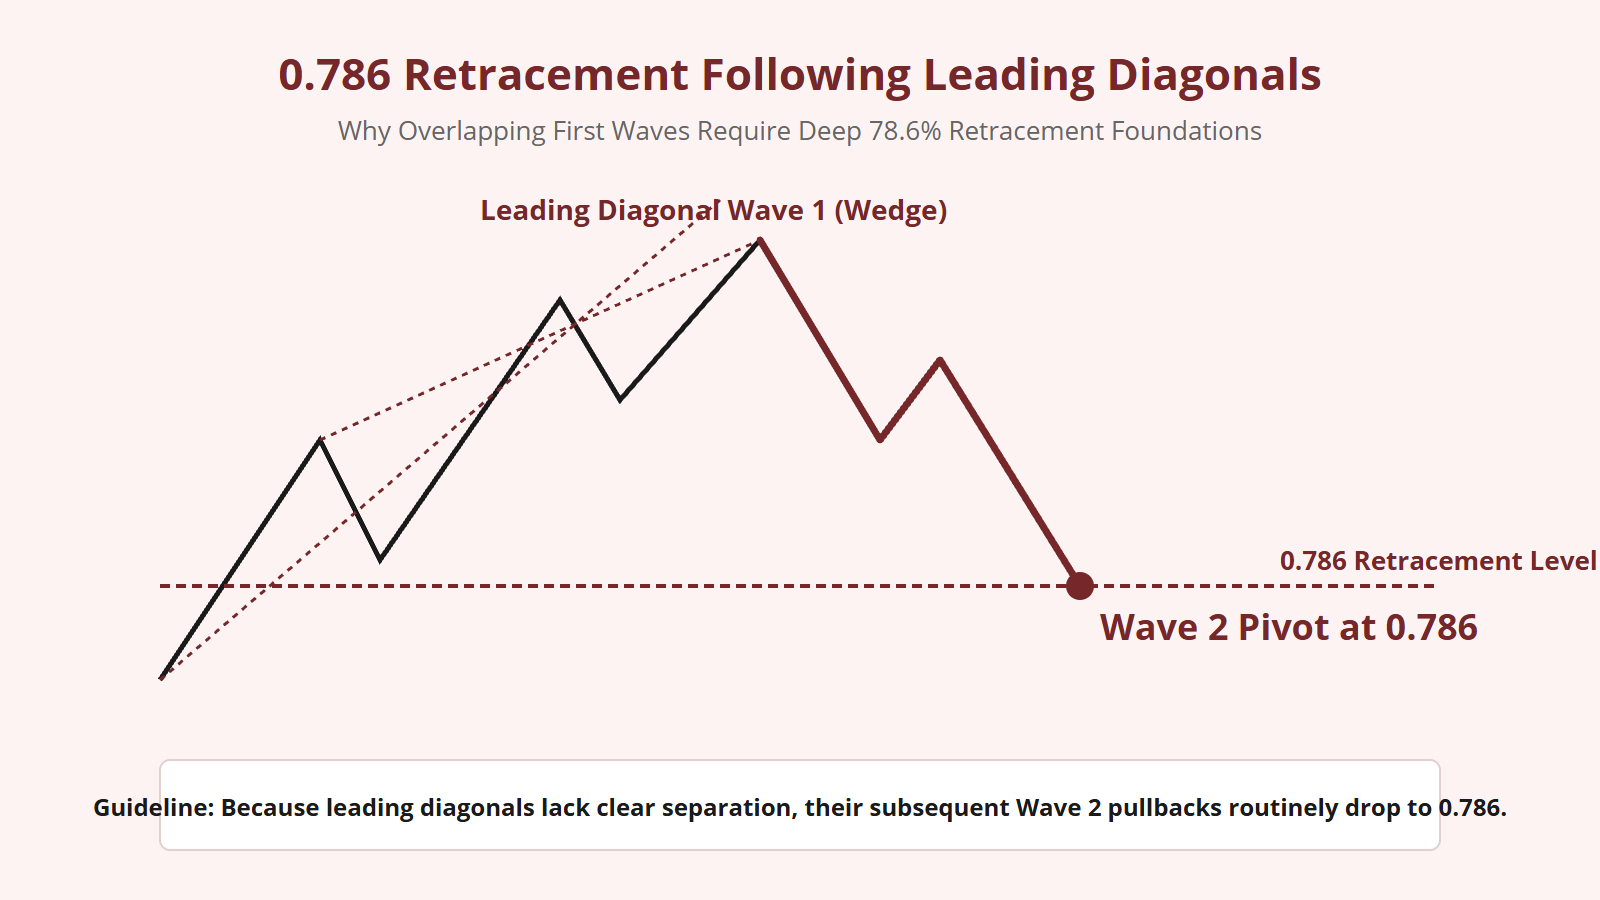
- Corrections Following Leading Diagonals: As detailed in wave mechanics, when Wave 1 unfolds as an overlapping Leading Diagonal (wedge), it reflects severe residual resistance from the prior regime. Because the first wave lacked clean, separation momentum, the subsequent Wave 2 almost universally executes a deep, exhaustive 0.786 retracement to establish a solid foundation before Wave 3 can launch.
When I see a leading diagonal on a chart, I immediately skip the 0.382 and 0.500 retracement levels and set my analytical sights directly on the 0.786 harmonic support zone.
The Final Line of Defense Before Invalidation
The greatest psychological utility of the 0.786 level is that it acts as the final structural gatekeeper before the 100% invalidation boundary.
Remember Cardinal Law 1: Wave 2 can never retrace 100% or more of Wave 1. Coordinate 1.000 is absolute death for the impulse count. However, there is a substantial expanse of price space between 0.618 and 1.000.
When price breaks below 0.618, retail traders declare the trend dead. As an Elliottician, I do not panic; I look at 0.786. If price stabilizes at 0.786—printing long lower wicks and completing internal five-wave sub-structures—the impulse count remains 100% mathematically valid!
The distance between 0.786 and 1.000 represents an area of maximum asymmetry: your invalidation level is tightly defined just below 1.000, while your prospective target (Wave 3 extension) lies hundreds or thousands of points above. This makes a confirmed 0.786 pivot one of the most mathematically favorable coordinates on any chart.
Subdivision Verification: Avoiding the Falling Knife
Positioning around a deep 0.786 retracement requires extreme structural discipline. Because price is falling rapidly, an analyst must never blindly buy the 0.786 line without internal sub-wave verification.
To confirm that a 0.786 test is a valid reversal pivot and not a catastrophic breakdown through 1.000, I verify three criteria:
- Sub-Wave 5 Completion in Wave C: The decline into 0.786 must be the final micro-subdivision (sub-wave [v] of Wave C).
- Severe Bullish Momentum Divergence: While price prints a deep new low at 0.786, multi-timeframe oscillators (RSI, MACD) must register dramatically higher lows compared to the Wave A low.
- Immediate Micro-Impulsive Reaction: Price must reject the 0.786 level with speed, printing a 5-wave micro-impulse higher on the 5-minute or 15-minute timeframe to confirm that institutional accumulators have absorbed all supply.
Summary Rules for the 0.786 Level
When integrating the 0.786 Fibonacci retracement into your operational playbook, remember these core axioms:
- 0.786 is the square root of the Golden Ratio ($\sqrt{0.618}$), representing deep harmonic elasticity.
- It is the standard, expected retracement target following a Leading Diagonal Wave 1.
- A breach of 0.618 does not invalidate an impulse; the count remains fully alive as long as 0.786 holds and 1.000 is respected.
- Always require internal sub-wave completion and momentum divergence before declaring a 0.786 pivot valid.
By understanding the mathematics of 0.786, you transform a zone of widespread retail panic into your greatest source of structural edge.


Leave a Reply