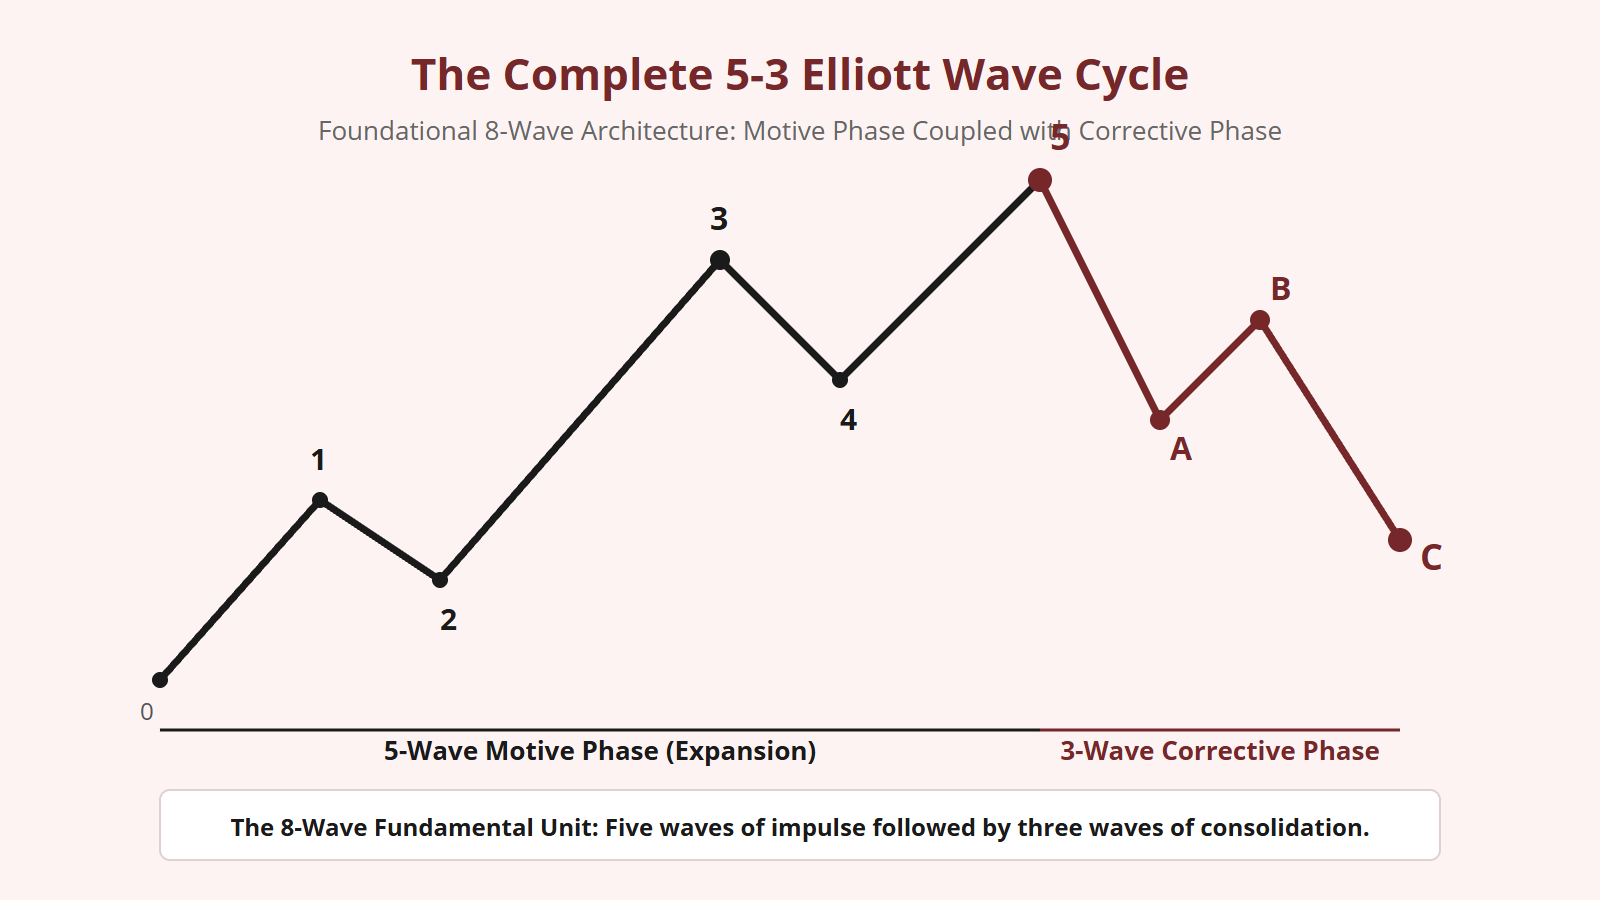
At the foundation of all market movements lies a simple, elegant mathematical rhythm: five waves of expansion followed by three waves of consolidation. This is the 5-3 Elliott Wave Cycle. When Ralph Nelson Elliott discovered this rhythm in the 1930s, he did not invent a technical indicator; he uncovered the natural geometric code governing mass human sentiment. In my daily structural mapping, every chart I inspect—regardless of time scale or asset class—is evaluated through the lens of this 8-wave fundamental unit. Mastering the 5-3 cycle is the essential prerequisite for navigating the fractal architecture of financial markets.
The Mathematical Foundation of the 8-Wave Unit
Why does the market advance in five waves and correct in three? Why not four and two, or six and four? The answer lies in the deep mathematical relationship between market mechanics and the Fibonacci summation sequence.
In the Fibonacci sequence (1, 1, 2, 3, 5, 8, 13, 21, 34, 55, 89…), every number is the sum of the two preceding numbers. In market geometry:
- The basic trend consists of 1 Motive Phase and 1 Corrective Phase = 2 Waves.
- The Motive Phase subdivides into 5 Waves (Waves 1, 2, 3, 4, 5).
- The Corrective Phase subdivides into 3 Waves (Waves A, B, C).
- Combining the motive and corrective phases yields exactly 8 Waves ($5 + 3 = 8$).
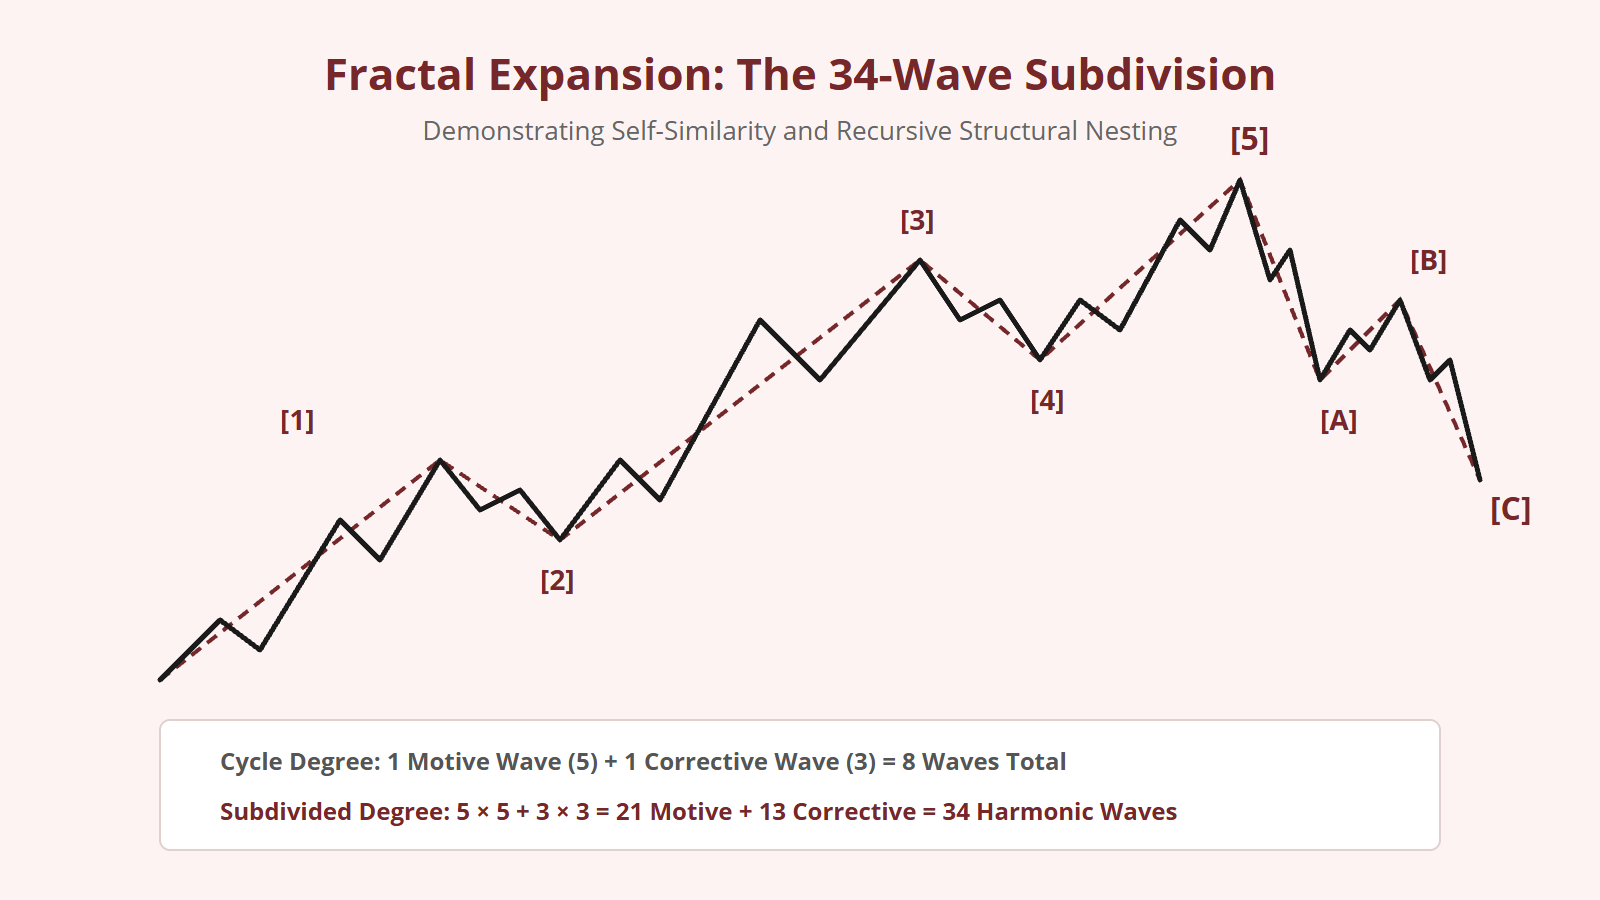
- When you subdivide those 8 waves into their internal components at the next lower degree, you discover 21 Motive sub-waves and 13 Corrective sub-waves, yielding exactly 34 Waves ($21 + 13 = 34$).
- Subdividing once more yields 89 Motive sub-waves and 55 Corrective sub-waves, producing exactly 144 Waves ($89 + 55 = 144$).
Every single number in the structural hierarchy of Elliott Wave degrees is an exact Fibonacci number. The 5-3 cycle is not an arbitrary human construct; it is the visual expression of the Fibonacci progression unfolding through collective human behavior.
The Motive Phase: Actionary Progression (1-2-3-4-5)
The primary function of the motive phase is to achieve structural progress in the direction of the larger trend degree. In an uptrend, the motive phase moves upward; in a downtrend, the motive phase moves downward. It consists of five distinct waves with clear roles:
- Wave 1: The foundational pivot, establishing structural accumulation and reversing the prior corrective regime.
- Wave 2: The corrective test, absorbing residual counter-trend pressure without breaching the origin of Wave 1.
- Wave 3: The kinetic expansion, breaking through prior resistance levels with maximum velocity, volume, and breadth.
- Wave 4: The rotational consolidation, consuming temporal duration and alternating in structure from Wave 2 without overlapping Wave 1.
- Wave 5: The structural climax, driving to a nominal new extreme amid diminishing momentum and public euphoria.
Within this motive phase, waves 1, 3, and 5 are actionary (moving in the trend direction), while waves 2 and 4 are reactionary (counter-trend pullbacks). This 3-actionary, 2-reactionary balance is what allows a five-wave structure to make net directional progress.
The Corrective Phase: Reactionary Rebalancing (A-B-C)
Once the five-wave motive phase fulfills its mathematical obligations, the market reaches an extreme state of structural disequilibrium. The system cannot sustain infinite expansion; it must pause, digest the prior advance, and rebalance historical excesses. This rebalancing is executed through the three-wave corrective phase, labeled A-B-C.
The corrective phase functions through a 2-actionary, 1-reactionary dynamic:
- Wave A: The initial corrective impulse, breaking the motive trend channel and alerting participants that the advance has concluded.
- Wave B: The deceptive counter-trend rally, attempting to re-test the Wave 5 high but lacking internal five-wave motive structure.
- Wave C: The decisive corrective resolution, unfolding as a full five-wave impulse that drives price down into key Fibonacci support zones (typically retracing between 38.2% and 61.8% of the entire 1-5 motive sequence).
Notice the vital mathematical asymmetry: because the motive phase contains five waves and the corrective phase contains only three, the market always retains a net directional bias. Three steps forward, two steps back—this is the eternal geometric engine of financial markets.
Fractal Self-Similarity: The 34-Wave Expansion
The supreme beauty of the 5-3 cycle is its scale invariance. As Benoit Mandelbrot established in fractal geometry, complex natural systems are self-similar across infinite scales of magnification. A coastline looks identical whether viewed from a satellite or through a magnifying glass; similarly, a 5-3 Elliott wave cycle looks identical whether mapped on a century chart or a 1-minute chart.
When I zoom into an 8-wave cycle, the fractal unfolds seamlessly:
- Wave 1 subdivides into 5 waves.
- Wave 2 subdivides into 3 waves.
- Wave 3 subdivides into 5 waves.
- Wave 4 subdivides into 3 waves.
- Wave 5 subdivides into 5 waves.
- Wave A subdivides into 5 waves (in a zigzag).
- Wave B subdivides into 3 waves.
- Wave C subdivides into 5 waves.
Total: $5 + 3 + 5 + 3 + 5 + 5 + 3 + 5 = 34 ext{ waves}$. When you understand structural nesting, you never get lost in intraday volatility. You always know exactly which sub-wave of which degree you are navigating.
The Unified Field: Navigating the Complete Cycle
To master the 5-3 cycle in practical analysis, I follow three core rules of structural discipline:
- Always Know Your Cycle Position: Before making any analytical projection, ask yourself: Am I in a motive phase (1-5) or a corrective phase (A-C)? Being in Wave 3 requires an entirely different strategy than being in Wave B.
- Respect the Power of Invalidation: The 5-3 cycle is governed by strict rules. If Wave 2 breaches Wave 1 origin, or Wave 4 overlaps Wave 1, the count is false. Let the geometry guide your count, not your personal desires.
- Anticipate the Next Fractal Degree: Remember that when your 5-3 cycle completes its 8 waves, it does not mark the end of the market. It simply marks the completion of Wave 1 and Wave 2 of the next higher degree of trend. The cycle expands infinitely outward and inward.
The 5-3 cycle is the universal grammar of market charts. When you learn to read its structural sentences and harmonize your analysis with the rhythm of Fibonacci proportions, the chaos of market fluctuations transforms into a symphony of mathematical order.


Leave a Reply