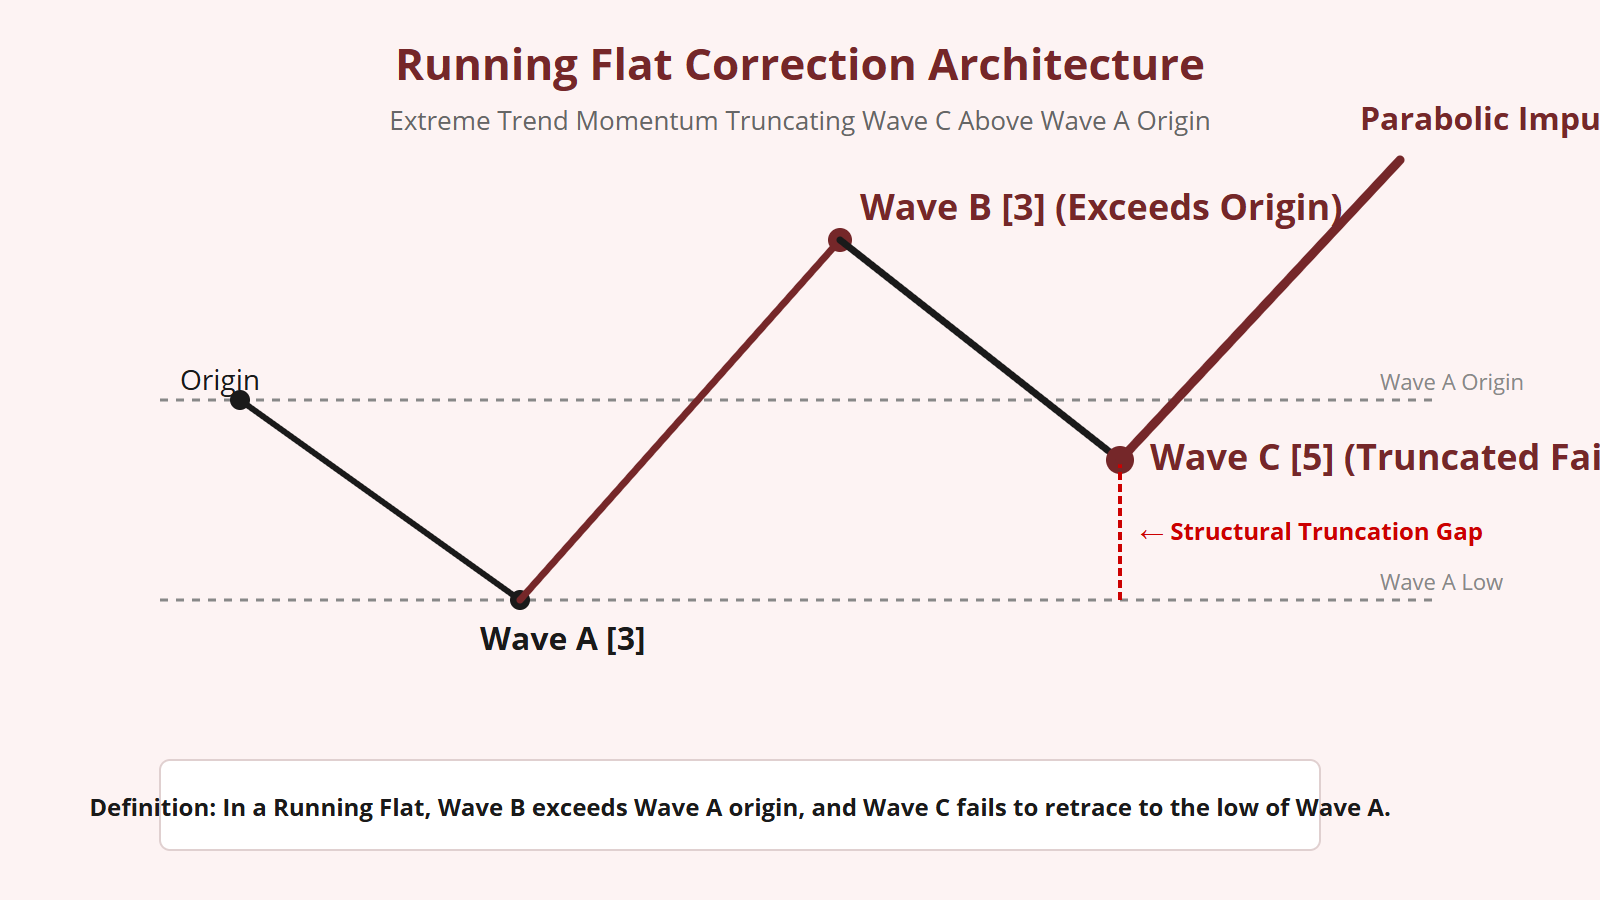
In standard corrective patterns, the market gives up a measurable amount of price territory as it digests a prior advance. However, in environments governed by overwhelming, generational trend momentum, the market refuses to correct in any meaningful downward direction. When sellers cannot even force price to retrace back to the origin of the correction, mass psychology produces a rare and highly bullish geometric anomaly: the Running Flat. In a Running Flat, Wave B exceeds the starting point of Wave A, but Wave C fails to retrace to the low of Wave A, truncating high in price space. Decoding a Running Flat requires recognizing that extreme trend velocity has completely skewed the corrective geometry.
The Phenomenon of Extreme Trend Skew
The Running Flat is the rarest of all flat corrections, but it carries the most explosive structural implications. It occurs exclusively in trends characterized by massive institutional demand and insatiable buying pressure.
In a standard correction, the market fluctuates between support and resistance. In a Running Flat, the underlying trend pressure is so ferocious that even during an official corrective phase, the market makes net directional progress in the trend direction!
Consider the structural sequence:
- Wave A executes a minor 3-wave pullback.
- Wave B rallies aggressively, easily surpassing the peak of the preceding motive wave (the origin of Wave A).
- Wave C attempts to decline, subdividing into the obligatory five internal sub-waves. However, aggressive buyers flood the market far above the Wave A low, aborting the decline and terminating Wave C at a structural higher low.
Because Wave C terminates well above the base of Wave A, the entire corrective pattern “runs” in the direction of the macro trend. When I identify a verified Running Flat, I know that the subsequent motive wave will be parabolic.
Mathematical Rules and Proportions of a Running Flat
Because the Running Flat is so structurally unique, an analyst must apply rigorous mathematical verification to prevent mislabeling a 1-2 / 1-2 nested impulse series as a running flat. A valid Running Flat must satisfy these strict geometric laws:
- Internal Formula (3-3-5): Wave A must be 3 waves (a-b-c); Wave B must be 3 waves (a-b-c); Wave C must be 5 waves (impulse or ending diagonal).
- Wave B Extension ($B > 1.000 imes A$): Wave B must clearly break above the origin of Wave A, typically reaching between 1.100 and 1.236 of Wave A.
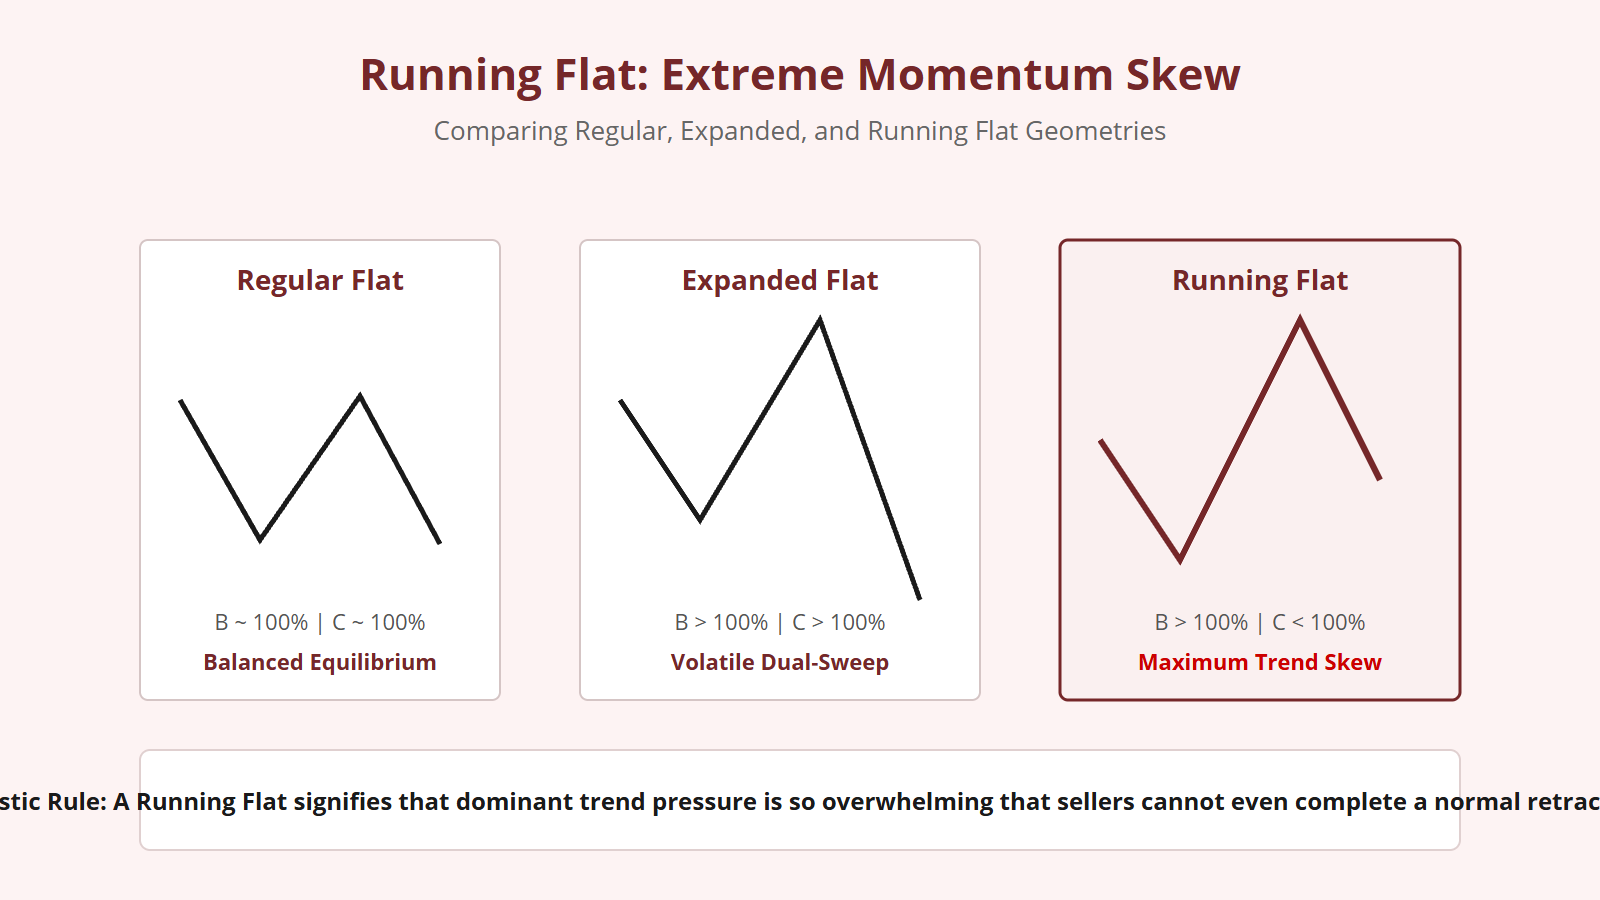
- Wave C Truncation ($C < 1.000 imes A$): This is the non-negotiable diagnostic rule: Wave C cannot reach the price level established by the trough of Wave A. It must terminate above the Wave A low, leaving a visible structural gap.
If Wave C reaches or exceeds the low of Wave A, the pattern is NOT a Running Flat; it is an Expanded Flat. The defining characteristic of a running flat is the complete failure of Wave C to achieve price parity with Wave A.
Diagnostic Warning: Running Flat vs. 1-2 / 1-2 Nesting
One of the most dangerous mistakes an Elliott Wave analyst can make is identifying a Running Flat when the market is actually constructing a series of nested first and second waves (Wave (1)-(2), 1-2). Both setups feature higher highs and higher lows, but their implications are radically different.
To avoid this trap, I apply a strict rule of subdivision verification:
- Inspect the internal sub-waves of Wave B. In a genuine Running Flat, Wave B MUST be a 3-wave corrective structure (a-b-c). If the rally of Wave B is an unambiguous 5-wave impulse, it is NOT Wave B of a running flat—it is Wave 3 of a nested impulse sequence!
- Inspect the internal sub-waves of Wave A. If Wave A is a 5-wave impulse, the structure cannot be a running flat, as all flats require a 3-wave Wave A.
Unless the 3-3-5 internal subdivision is mathematically verified beyond doubt, I default to a nested impulse interpretation. True Running Flats are rare, and claiming their presence without sub-wave proof is an analytical error.
The Explosive Thrust Following Wave C
When a verified Running Flat completes its truncated Wave C, the market possesses an enormous reservoir of unspent kinetic energy. The fact that sellers could not even push price back to the Wave A low proves that supply is non-existent.
The moment Wave C terminates, the dominant trend explodes higher in an uncompromising, near-vertical trajectory. In my historical case studies, the motive wave that launches off a Running Flat (typically Wave 3 or Wave 5) consistently achieves maximum Fibonacci extensions, frequently reaching 2.618 or 3.618 relative to prior waves.
Market participants who anticipated a normal, deep pullback are left stranded on the sidelines as price accelerates away from them without providing a single significant pullback.
Summary Checklist: Identifying Running Flats
When evaluating potential running corrections, apply this rigorous 4-point checklist:
- Check Macro Context: Running flats appear almost exclusively in powerful Wave 2 (after historic trend shifts) or Wave 4 positions (prior to extended 5th waves).
- Confirm 3-Wave Subdivisions in A and B: Ensure that both legs are strictly corrective and non-impulsive.
- Measure Wave C Truncation: Confirm that Wave C completes five internal micro-waves while remaining distinctly above the Wave A trough.
- Prepare for Parabolic Velocity: Once price breaks above the Wave B apex, trail stops tightly along the micro-wave lows and ride the impending explosive extension.
The Running Flat is the ultimate testament to the dominance of trend momentum over corrective gravity. When you master its subtle geometry, you unlock the ability to spot the most aggressive, explosive moves in financial geometry before they leave the rest of the market behind.


Leave a Reply