While most Fibonacci analysis focuses on internal retracements between zero and 100%, market geometry frequently expands beyond historical boundaries during complex corrective phases. When an over-extended wave exceeds the origin of an antecedent move, it does not do so arbitrarily; it adheres to a precise mathematical law of harmonic expansion. The primary ratio governing these corrective overshoots is the Inverse Fibonacci Ratio: 1.272. Derived directly as the square root of the Golden Section (1.618), the 1.272 ratio is the master key for deciphering Expanded Flats, false breakouts, and liquidity sweeps. In my analytical practice, mapping the 1.272 extension is essential for recognizing when a breakout is a genuine impulse or a deceptive corrective trap.
The Mathematical Foundation of the 1.272 Ratio
In quantitative geometry, 1.272 is known as the Inverse Golden Ratio or the Harmonic Extension Ratio. It is derived directly as the square root of the primary Golden Mean ($\Phi = 1.6180339887…$):
$$\sqrt{1.6180339887…} \approx 1.272019649… \approx 1.272$$
Notice the profound mathematical symmetry: just as 0.786 is the square root of the internal Golden Ratio ($0.618$), 1.272 is the square root of the external Golden Ratio ($1.618$). Furthermore, 1.272 and 0.786 are exact mathematical reciprocals of one another:
$$\frac{1}{1.272} \approx 0.786 \quad \text{and} \quad \frac{1}{0.786} \approx 1.272$$
In market architecture, 1.272 represents the first natural mathematical harmonic beyond the 100% boundary. When a price swing fully retraces an antecedent move ($1.000$) and continues to expand into new price territory, 1.272 is the primary geometric threshold where kinetic inertia exhausts its expansion energy.
The Primary Habitat: Wave B in Expanded Flats
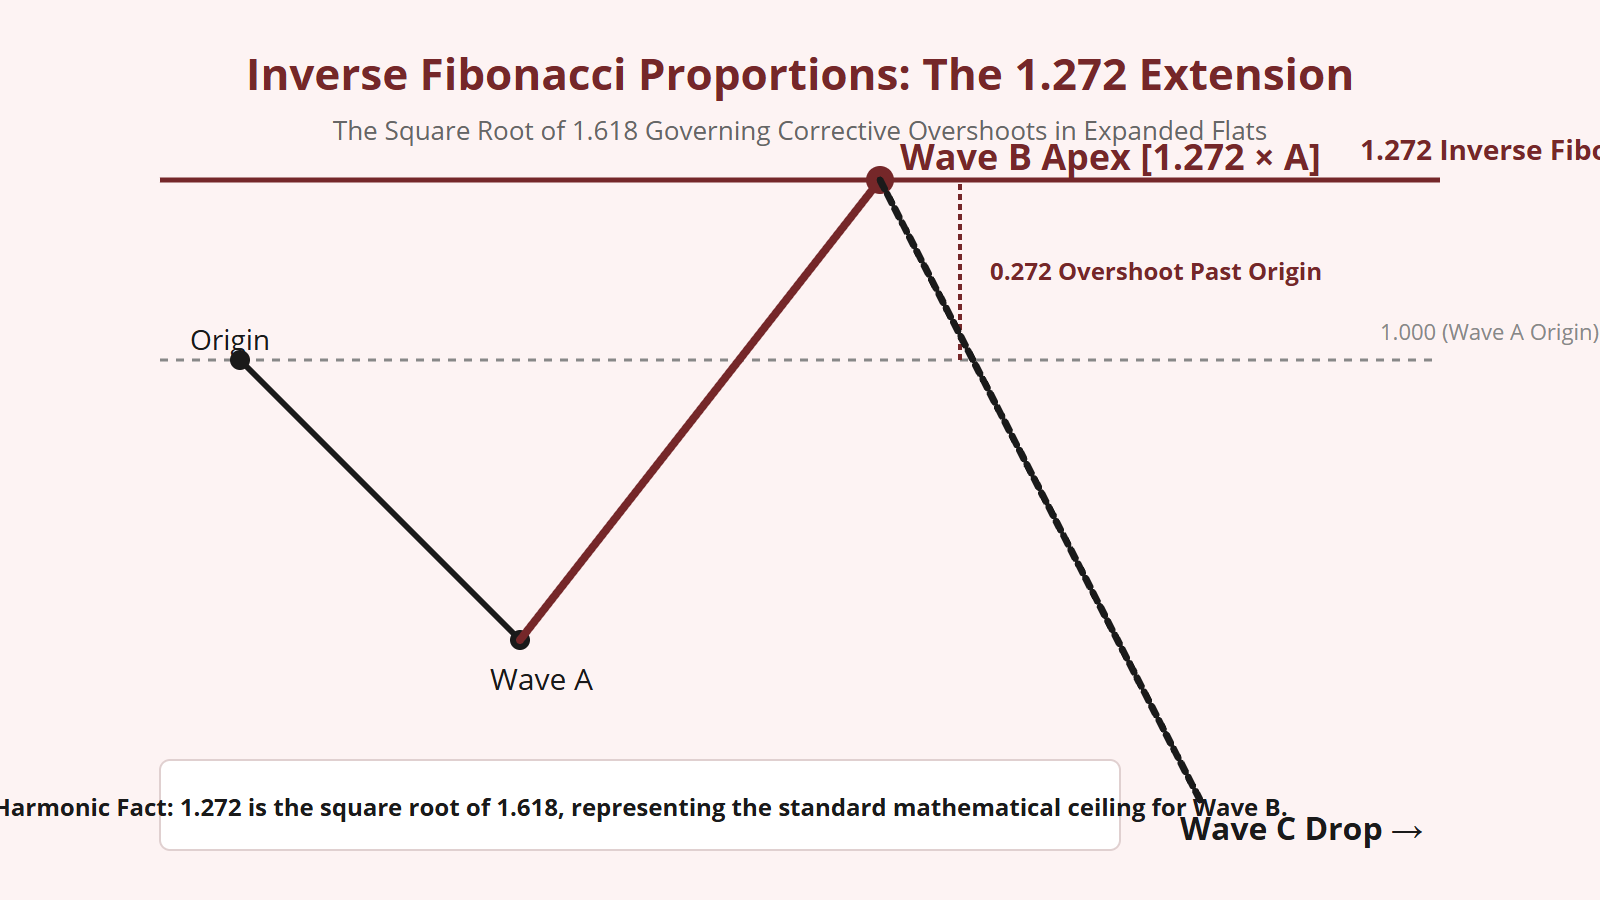
The single most important application of the 1.272 ratio in the Elliott Wave Principle occurs within the Expanded Flat correction (3-3-5).
As detailed in our structural studies, an Expanded Flat is characterized by a deceptive Wave B that rallies beyond the starting point of Wave A. To the retail chartist, this breakout looks like the resumption of the macro bull trend. But to a trained Elliottician, it is an over-extended B-wave.
Where does this deceptive B-wave terminate? In over 70% of verified expanded flats, Wave B exhausts its momentum precisely at the 1.272 Fibonacci extension of Wave A:
$$\text{Wave B Target} = \text{Origin of A} + (\text{Length of Wave A} \times 0.272)$$
When price pierces the Wave A origin, sweeps liquidity above the old high, and tags the 1.272 extension with momentum divergence, the trap is sprung. Wave B terminates, and Wave C unleashes its devastating five-wave decline in the opposite direction.
The 1.272 Ratio as a Liquidity Sweep Anchor
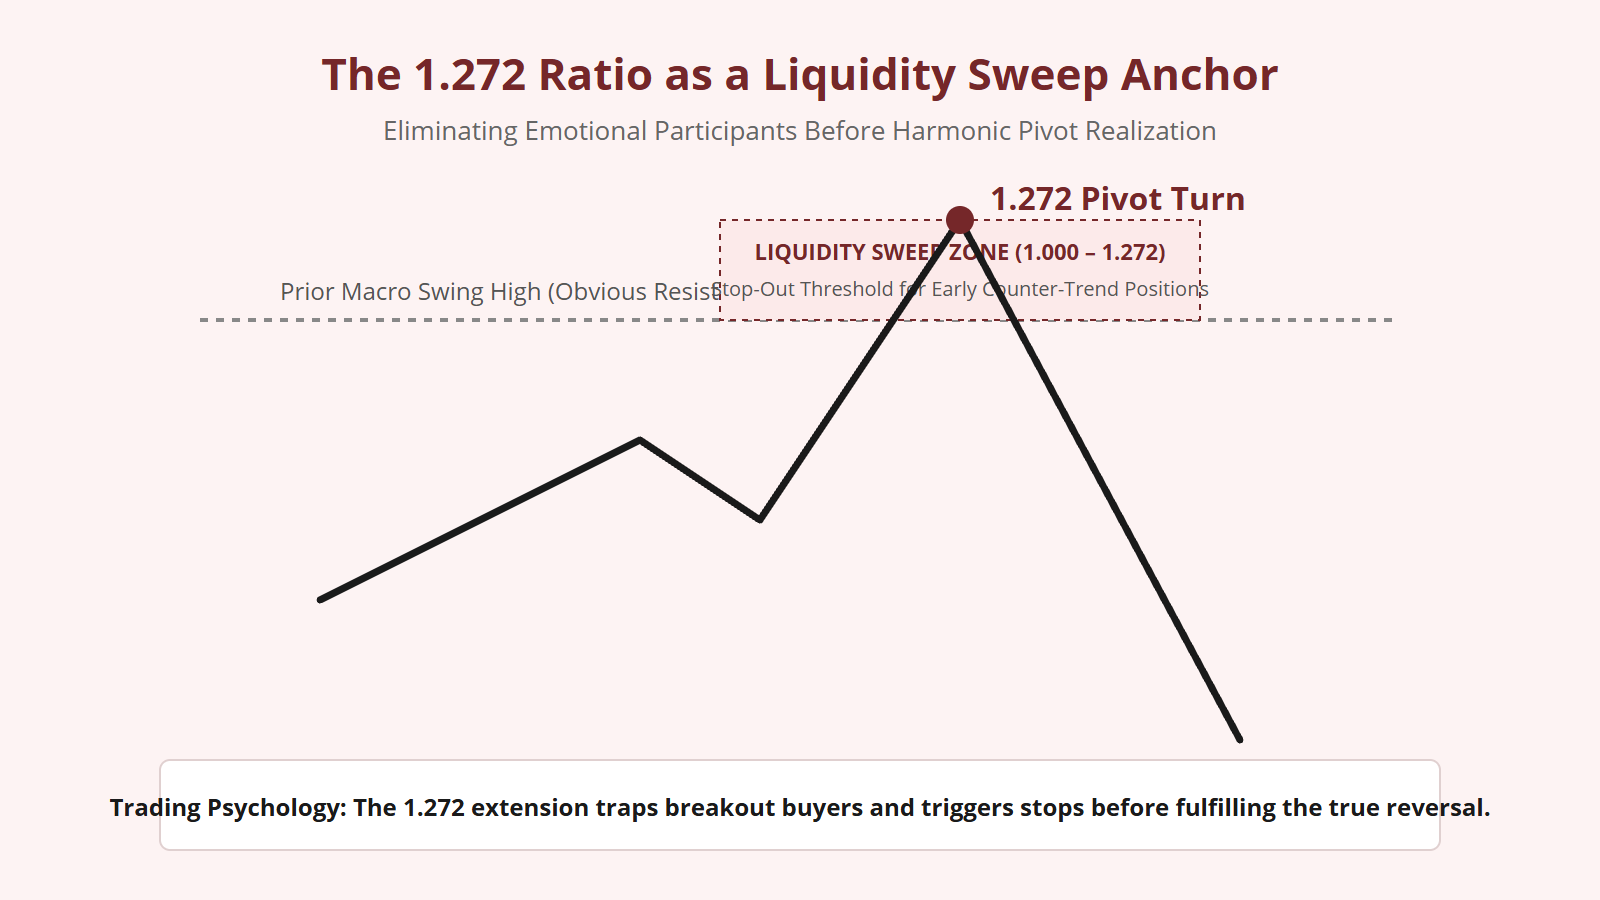
Modern electronic markets are heavily driven by algorithmic order flow. Large institutions cannot enter substantial counter-trend positions without sufficient opposing liquidity. To generate that liquidity, algorithms engineer false breakouts past obvious structural levels.
An obvious swing high represents a massive concentration of resting orders: breakout buy-stop orders and stop-loss orders from early short-sellers. By driving price through the swing high, institutions trigger these buy orders, allowing them to unload large positions into the surge.
The 1.272 Fibonacci ratio is the mathematical boundary of this liquidity sweep. Algorithms are programmed to push price approximately 27.2% beyond the prior range—just far enough to clear all resting stops, but not far enough to sustain a genuine new trend. Once the stops are absorbed between 1.000 and 1.272, buying pressure vanishes, and the market collapses back inside the original range.
Distinguishing Impulses from 1.272 Corrective Traps
The greatest challenge when price punches to a new high is distinguishing between a genuine third wave impulse breakout and a deceptive 1.272 B-wave trap. To make this distinction with absolute objectivity, I apply two mathematical tests:
- Internal Subdivision Test: A genuine impulse breakout must subdivide into five impulsive micro-waves ([i]-[ii]-[iii]-[iv]-[v]) with expanding volume and steep slope. A 1.272 corrective trap subdivides into three corrective waves (a-b-c) with overlapping sub-waves and contracting volume.
- Reaction at 1.272: In a genuine trend, price slices through 1.272 without hesitation, accelerating toward the 1.618 and 2.618 extensions. In a corrective flat, price stalls immediately upon tagging 1.272, printing reversal candlestick wicks and showing severe momentum divergence.
If an advance to new highs only contains three waves and stalls at 1.272, it is a textbook B-wave trap, warning you to prepare for an immediate downward cascade in Wave C.
Operational Guidelines: Mapping the 1.272 Level
To utilize the 1.272 inverse ratio effectively in your charting, incorporate these operational rules:
- Always Plot 1.272 on Corrective B-Waves: Whenever price approaches the origin of Wave A, extend your Fibonacci tool to include the 1.272 and 1.382 external levels.
- Never Chase Breakouts Stalling at 1.272: Buying a new high that has tagged 1.272 on a 3-wave subdivision is structural suicide. Wait for the market to prove whether it can sustain momentum past 1.618.
- Use 1.272 as a Target for Wave C Projections: In shallow flats, internal Wave C frequently terminates at 1.272 of Wave A, providing a reliable target for the conclusion of the entire consolidation.
The 1.272 inverse ratio bridges the gap between internal retracements and external extensions. By understanding its role as the square root of Phi, you gain the mathematical vision to see through market traps and trade with total structural confidence.


Leave a Reply