The most profound realization I had when studying market geometry is that price structures are entirely scale-invariant. The market is a fractal. A pattern that unfolds over ten years contains the exact same mathematical properties as a pattern that unfolds over ten minutes. To navigate this, I utilize the concept of structural nesting. Every wave I analyze is simultaneously a component of a larger wave and composed of smaller sub-waves. By mapping these concentric degrees of trend, I maintain absolute geometric context.
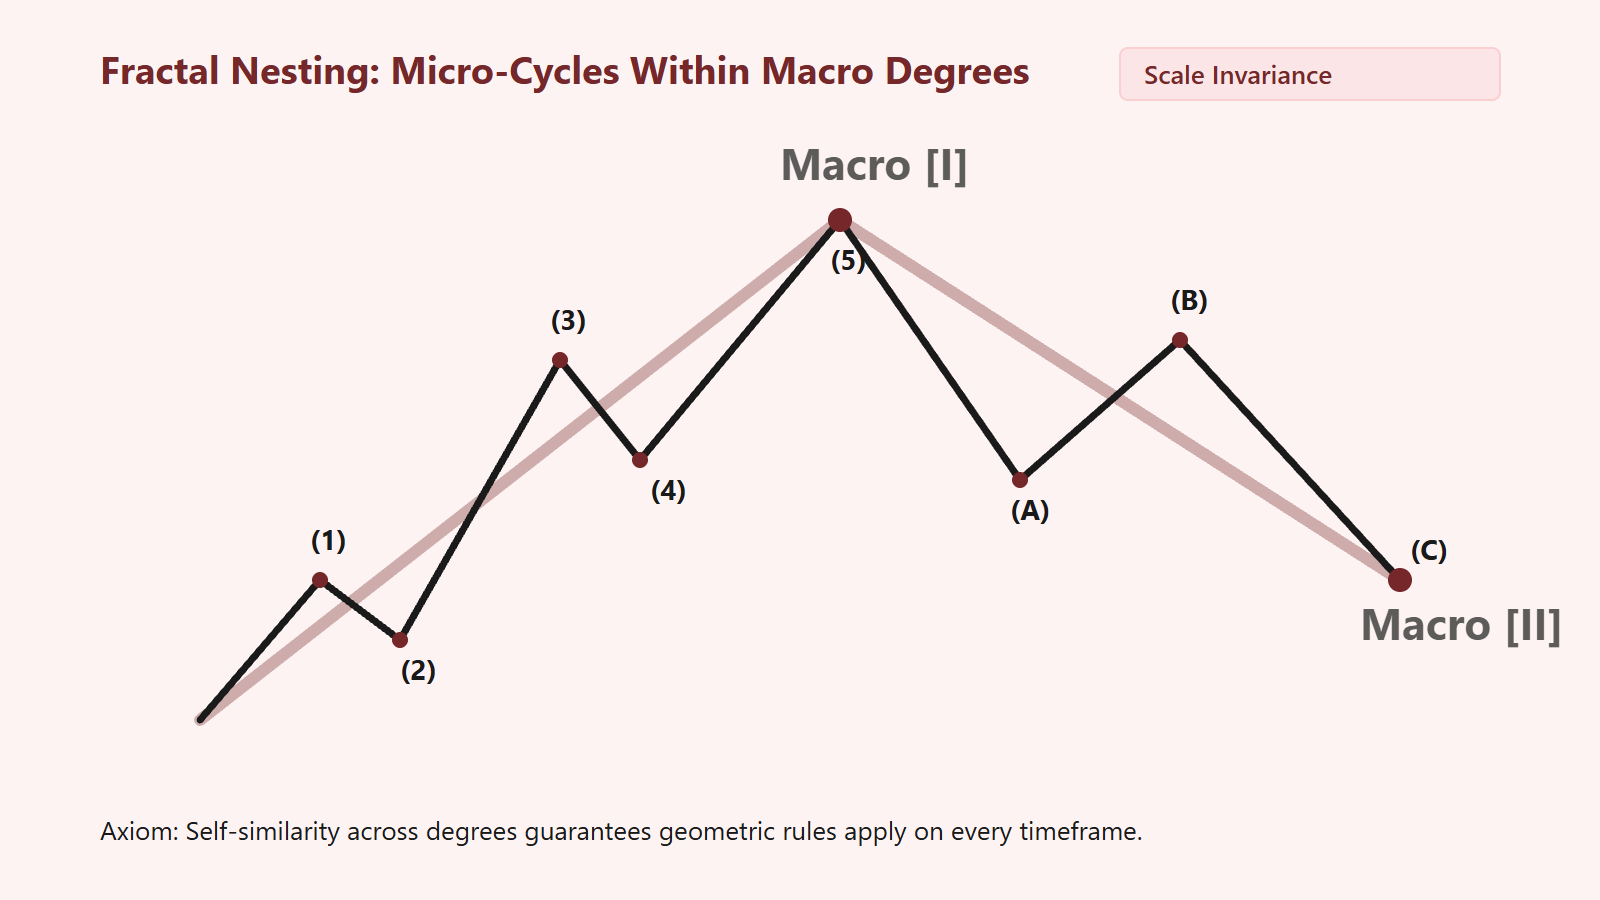
The Mathematical Reality of Scale Invariance
In standard classical charting, analysts frequently treat different timeframes as discrete, disconnected entities. An analyst might view a daily chart as “bullish,” a 1-hour chart as “bearish,” and a 5-minute chart as “neutral,” leading to crippling cognitive dissonance and fragmented decision-making. In my framework, there is no such thing as isolated timeframes. There is only a single, continuous, scale-invariant fractal unfolding across varying degrees of resolution.
Benoit Mandelbrot formalized this phenomenon in fractal mathematics: an object exhibits self-similarity when its parts, at whatever magnification, resemble the shape of the whole. In market mechanics, an impulse wave consists of five distinct sub-waves. When you zoom in on Wave 1 of that sequence, you discover that it too is composed of five smaller sub-waves. If you zoom into Wave (i) of that sub-wave, another set of five micro-waves emerges. Conversely, when you step back to view the multi-decade horizon, that entire five-wave sequence forms merely Wave 1 of a grand supercycle.
This structural nesting is the geometric bedrock of the Elliott Wave Principle. Once you grasp that price action does not change its mathematical governing laws based on time duration, your analytical focus shifts entirely from chronological timeframes to hierarchical wave degrees.
The Hierarchy of Wave Degrees
To systematically organize nested structures without succumbing to visual chaos, I employ a standardized notation system that categorizes wave cycles by their relative degree of magnitude. Elliott identified nine distinct degrees of trend, spanning from multi-century supercycles down to sub-minuette oscillations lasting only minutes.
In standard structural practice, the most commonly encountered operational degrees include:
- Primary Degree [①, ②, ③, ④, ⑤ / Ⓐ, Ⓑ, Ⓒ]: Multi-year structural cycles that define the macro secular trend. Primary waves govern the long-term structural architecture.
- Intermediate Degree ((1), (2), (3), (4), (5) / (A), (B), (C)): Multi-month subdivisions that build out the primary waves. Each Primary wave subdivides into five (or three) Intermediate waves.
- Minor Degree (1, 2, 3, 4, 5 / A, B, C): Multi-week swings that provide the operational landscape for swing mapping. An Intermediate Wave (3) consists of five Minor waves labeled 1 through 5.
- Minute Degree [i, ii, iii, iv, v / a, b, c]: Multi-day sub-structures that confirm whether a Minor wave is fulfilling its internal Fibonacci requirements.
- Minuette Degree ((i), (ii), (iii), (iv), (v)): Intraday micro-structures that reveal real-time inflection points and exhaustion patterns.
Understanding degree hierarchy allows me to anchor my analysis in structural proportion. A Minor wave can never exceed its parent Intermediate wave in structural importance, nor can a Minor Wave 4 overlap an Intermediate Wave 1 low. The rules of wave mechanics apply universally, but they must be respected strictly within their respective degrees.
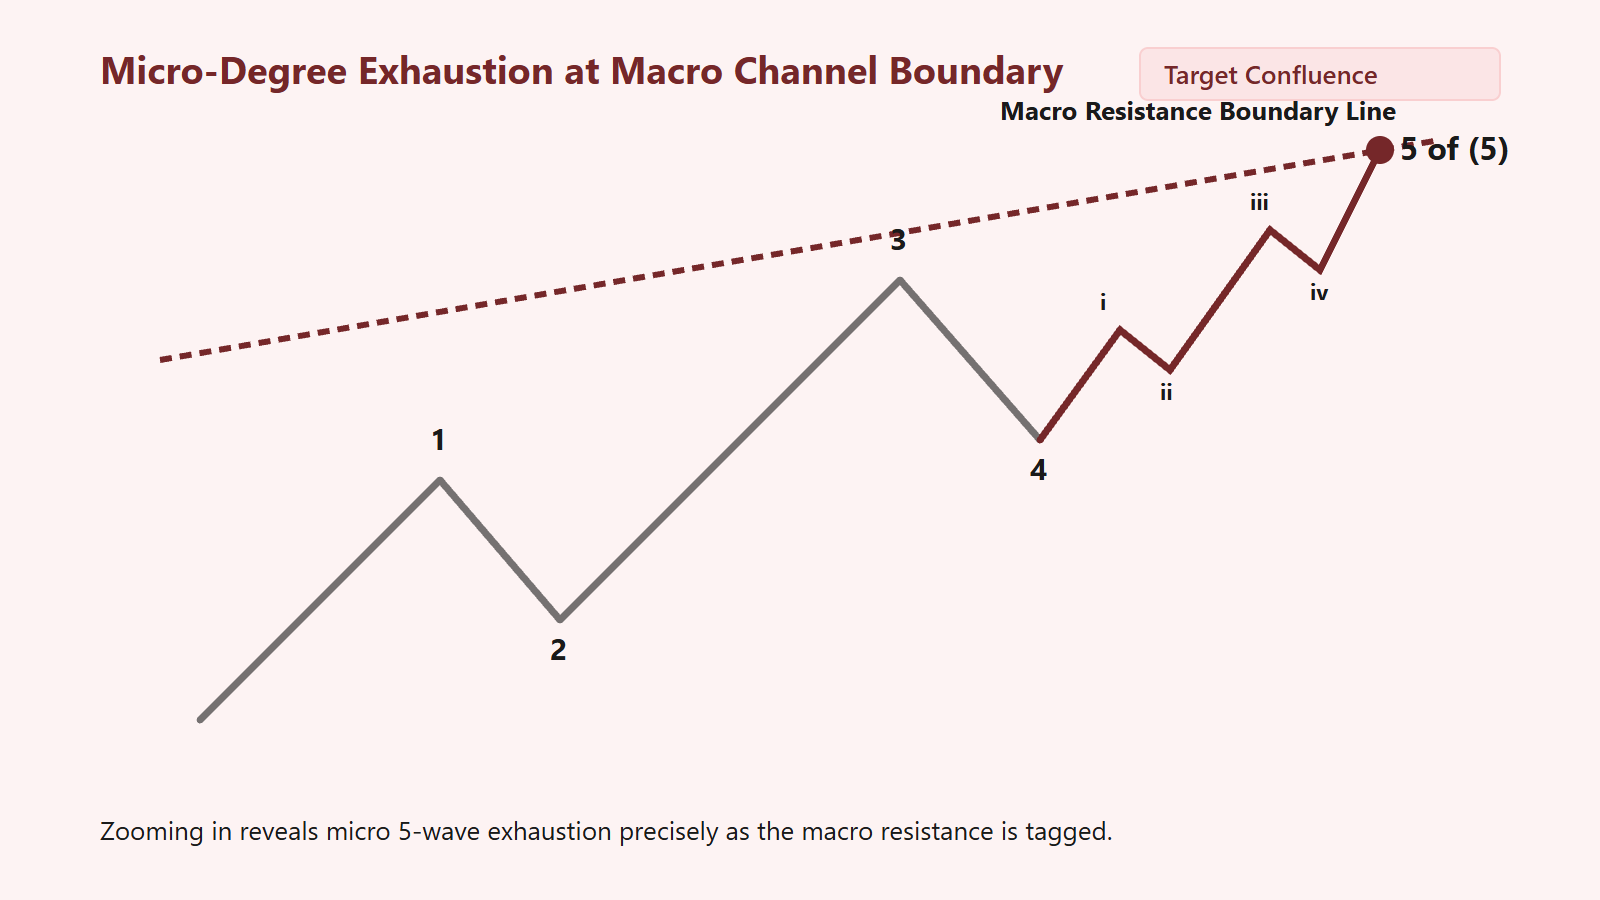
Pinpointing Macro Exhaustion Through Micro Confluence
The supreme practical advantage of fractal nesting is the ability to anticipate the precise termination point of a massive macro trend by monitoring the internal completion of micro-structures. When an analyst looks only at a macro monthly chart, an approaching Wave 5 crest may appear vast, imprecise, and impossible to time within several hundred points. By zooming into nested sub-waves, that massive target area collapses into an exact price coordinate.
I call this analytical phenomenon Concentric Wave Termination. Consider a scenario where a market is approaching the upper boundary of a multi-year Primary Wave ⑤. How do I know when the macro wave has reached mathematical exhaustion?
- I verify that Intermediate Wave (5) of Primary Wave ⑤ is nearing completion.
- I drop down to the Minor degree and observe that Minor Wave 5 of Intermediate Wave (5) is active.
- I zoom into the Minute degree and identify four completed sub-waves, with Minute Wave v currently expanding.
- Finally, on the Minuette degree, I track the micro 5-wave impulse of Minute v. When Minuette wave (v) completes its fifth micro-wave, all concentric degrees—from Minuette up to Primary—terminate simultaneously.
When multiple degrees of trend complete their structural requirements at the exact same price and time coordinate, the market experiences an instantaneous collapse of directional momentum. This is why major market tops and bottoms appear so violent: the exhaustion is not occurring merely on a single timeframe, but across the entire fractal hierarchy simultaneously.
Mathematical Self-Similarity Across Degrees
What makes nested fractals so visually mesmerizing is that the exact same Fibonacci ratios govern each concentric layer. The Golden Ratio ($\Phi = 1.618$) is omnipresent across all degrees of trend.
If you examine a Primary Wave ③, you will find that it frequently extends to precisely 1.618 or 2.618 times the length of Primary Wave ①. If you examine Intermediate Wave (3) inside that Primary structure, it will independently extend to 1.618 of Intermediate Wave (1). And within that Intermediate wave, Minor Wave 3 will independently fulfill its 1.618 expansion relative to Minor Wave 1.
When these independent Fibonacci projections align at a single price level, they create a Multi-Degree Fibonacci Cluster. For example:
- Primary Wave ⑤ target = 1.000 of Primary Wave ① at 4,500.
- Intermediate Wave (5) target = 1.618 of Intermediate Wave (1) at 4,502.
- Minor Wave 5 target = 0.618 of Minor Waves 1 through 3 at 4,498.
When three distinct wave degrees generate independent Fibonacci projection targets that converge within a narrow 4-point band, the mathematical probability that the market reverses at that cluster approaches structural certainty. This confluence cannot be observed if you only analyze charts through single-degree perspectives.
Best Practices: Maintaining Multi-Degree Alignment
To master structural nesting and eliminate timeframe confusion, I incorporate the following analytical disciplines into my daily mapping routine:
- Always Work Top-Down: Never begin your analysis on a micro chart. Always establish the macro Primary and Intermediate degree count first. Once the macro directional bias and overarching structural boundary are fixed, step down into Minor and Minute degrees to analyze the immediate operational structure.
- Maintain Notation Integrity: Rigorously utilize standardized brackets, parentheses, and Roman numerals to distinguish degrees. Blurring notation degrees on your charts leads directly to analytical blindness.
- Honor Structural Cardinal Rules at Every Degree: A wave count is invalidated if any fundamental rule is broken at any degree. If an alleged Minor Wave 4 overlaps Minor Wave 1 in an impulse sequence, the count is false—regardless of how elegant the Intermediate degree count looks. The micro-structure must validate the macro-structure, without exception.
Fractal nesting transforms chaotic price movement into a structured, multi-dimensional crystal. By learning to perceive the market as an interconnected hierarchy of self-similar geometric forms, you acquire the vision to see the entire forest while analyzing the precise curvature of every individual leaf.


Leave a Reply