When I map market structures, identifying the wave pattern is only the first step. To pinpoint exactly where a wave is mathematically probable to terminate, I must apply the second pillar of the Elliott Wave Principle: Fibonacci proportions. The wave structure provides the form, but Fibonacci mathematics provides the exact scale and measurement of that form.
Ralph Nelson Elliott discovered that the structural progression of the market is governed by the exact same mathematical sequence that dictates natural growth, fractal geometry, and universal proportions. When I apply these ratios to a chart, I am not guessing at random support and resistance levels; I am measuring the exact geometric footprint of mass human psychology.
The Golden Ratio (1.618) as the Foundation
The foundation of my proportion analysis rests on the Golden Ratio, denoted by the Greek letter Phi (1.618), and its inverse (0.618). This ratio is derived directly from the Fibonacci sequence (0, 1, 1, 2, 3, 5, 8, 13, 21, 34, 55, 89…), where each number is the sum of the two preceding ones. As the sequence progresses, the ratio of any number to its predecessor asymptotically approaches 1.618.
In market geometry, impulse waves and corrective waves relate to one another by these exact mathematical proportions. If I know the geometric length of Wave 1, I can mathematically calculate the high-probability termination zones for Waves 2, 3, 4, and 5 before they even unfold. This turns technical analysis from a guessing game into a rigorous mathematical discipline.
Measuring Corrective Retracements (Waves 2 and 4)
When a directional motive wave concludes, the market must consolidate. I measure these corrective pullbacks using Fibonacci retracement ratios: primarily 0.382, 0.500, 0.618, and 0.786.
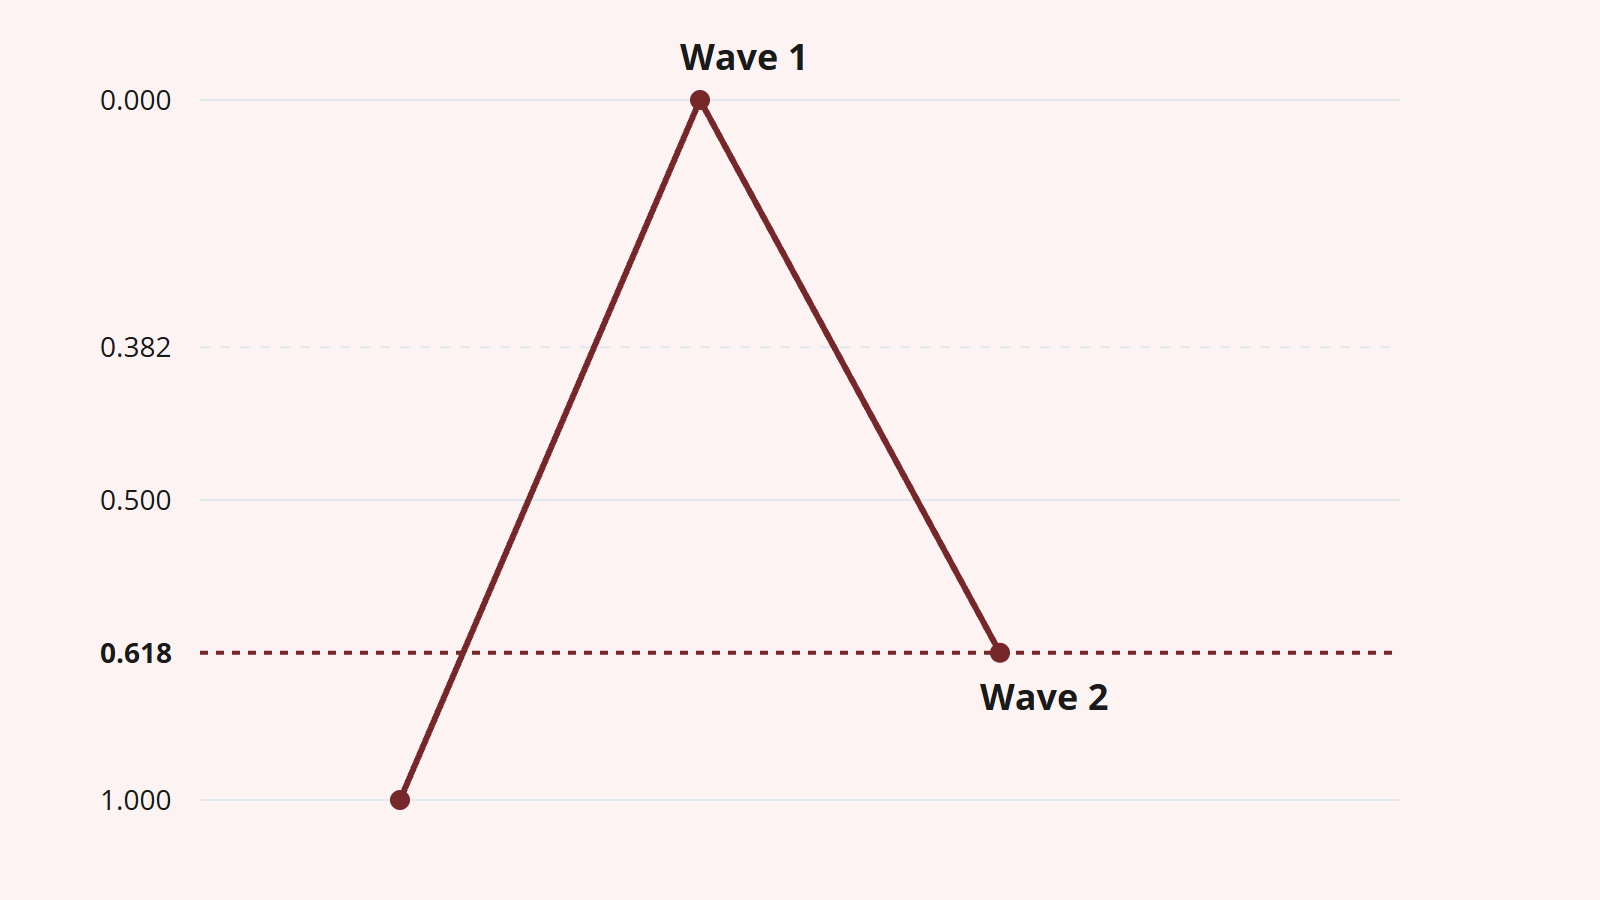
I apply different mathematical expectations depending on which specific wave is correcting:
- Wave 2 Retracements: Wave 2 typically yields a deep geometric retracement of Wave 1. I consistently look for Wave 2 to terminate at the 0.618 or 0.786 Fibonacci ratio of Wave 1. Because of the axiom that Wave 2 can never retrace more than 100% of Wave 1, this mathematical boundary is absolute. If it breaks the 100% mark, my structural thesis is wrong.
- Wave 4 Retracements: In contrast, Wave 4 is usually a shallow consolidation, adhering to the rule of alternation. I map Wave 4 to typically retrace 0.382 of the preceding Wave 3. If it retraces deeper, I monitor the 0.500 level, but I remain highly aware of the strict axiom that Wave 4 must never overlap the price territory of Wave 1.
Projecting Motive Extensions (Waves 3 and 5)
While retracements measure contractions, Fibonacci extensions measure expansions. When I anticipate the explosive growth of a Wave 3, I rely heavily on the 1.618 multiplier.
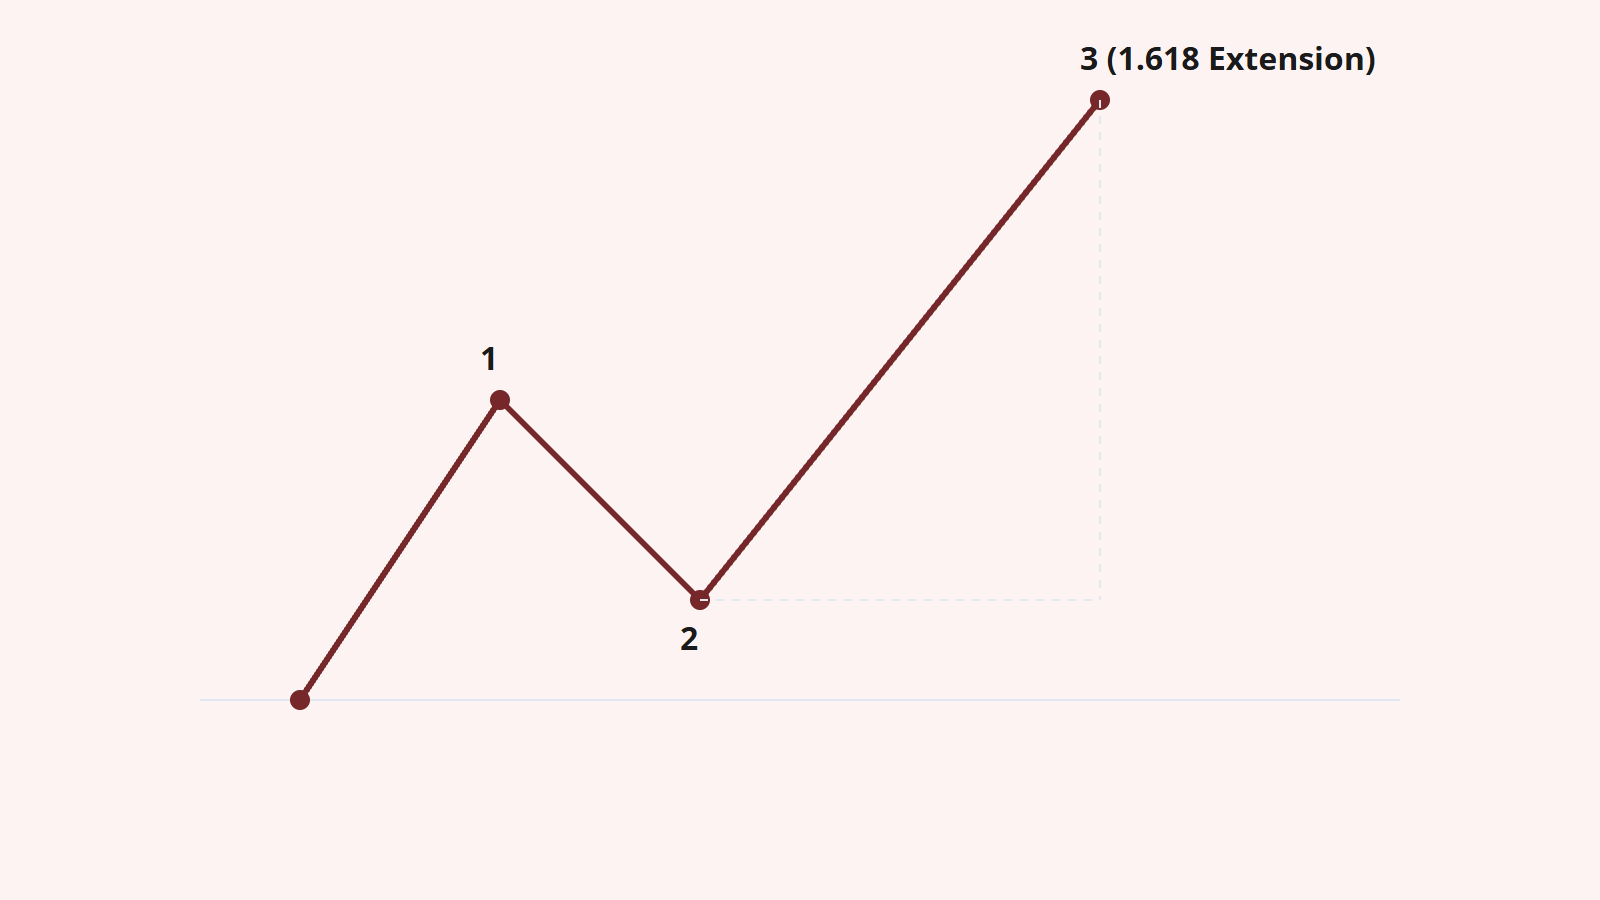
In a standard five-wave impulse, one of the three motive waves (1, 3, or 5) will extend. Wave 3 is the most common extension. To project its target, I measure the net displacement of Wave 1, multiply that distance by 1.618, and project it from the absolute bottom of Wave 2. If the market exhibits extreme momentum, this projection can expand to 2.618 or even 3.618.
If I observe that Wave 3 has extended, mathematical symmetry dictates that Wave 5 will likely equal Wave 1 in length (a 1:1 ratio), or it will relate to the net distance of Waves 1 through 3 by a 0.618 ratio. This structural symmetry allows me to lock in objective targets for the final termination of a macro cycle.
Fractal Universality: From Shells to Price Action
The reason I trust these ratios implicitly is that they are not unique to financial charts. They are universal laws of growth and decay.
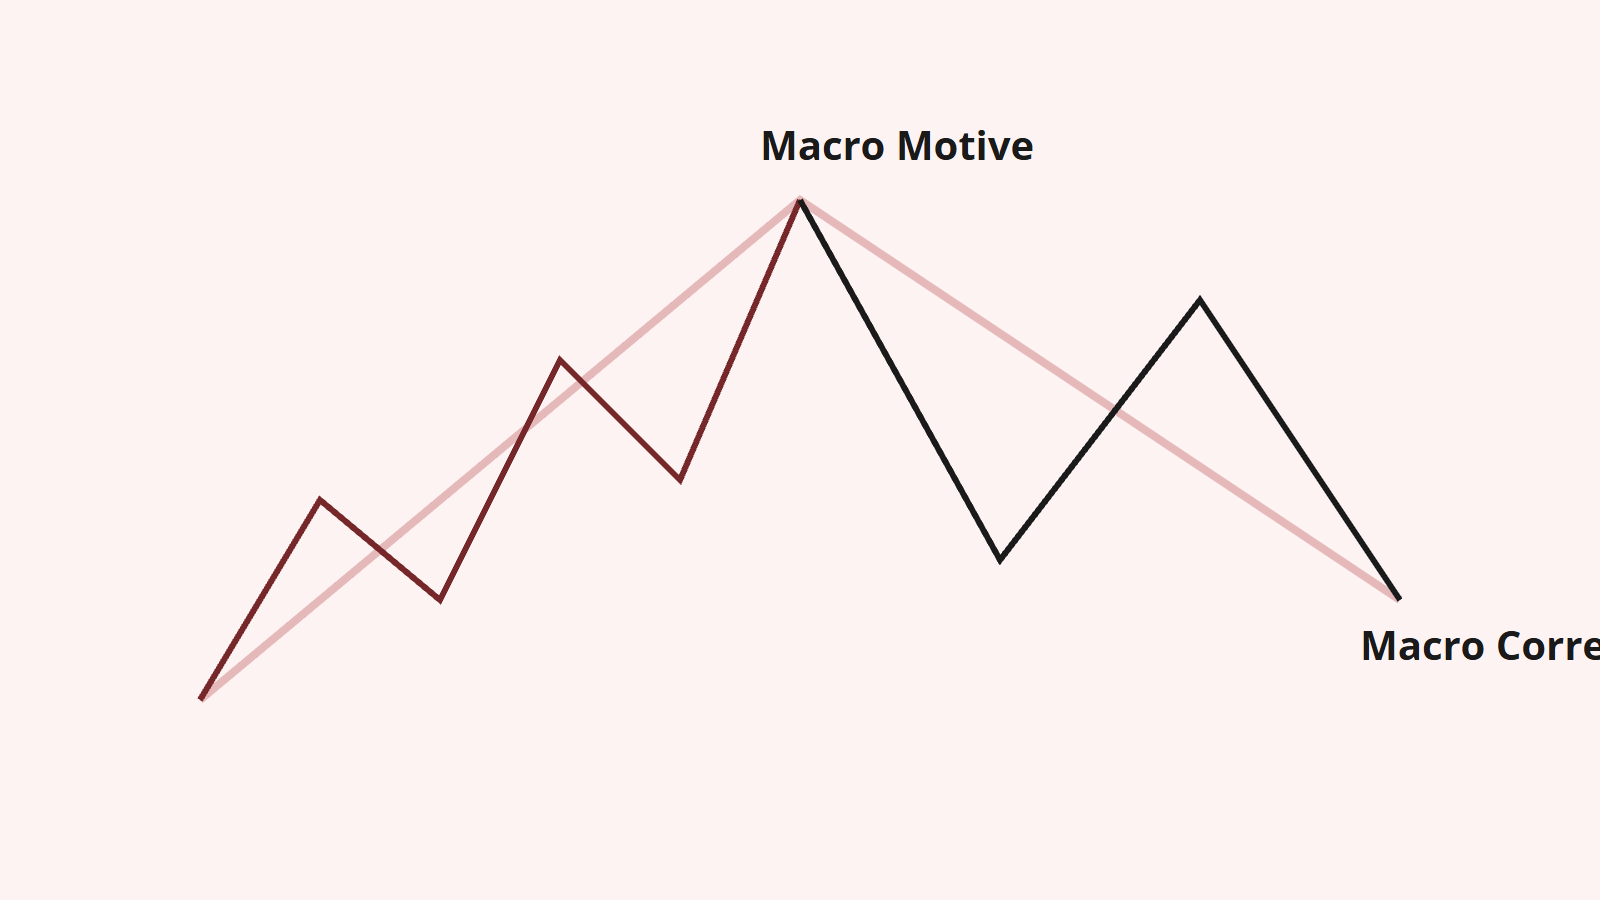
Just as the chambered nautilus expands its shell outward at a logarithmic rate governed by the Golden Ratio, human behavior expands and contracts in the exact same mathematical spiral. I never use Fibonacci ratios in isolation. A 0.618 retracement level is mathematically meaningless if it does not align with a structurally complete internal wave count. My analysis demands confluence: the internal subdivisions of the wave must mathematically complete precisely at the Fibonacci projection level.
By marrying the rigid geometric axioms of wave structures with the objective measurements of Fibonacci mathematics, I strip all emotion, bias, and guesswork from my charts. The result is a purely mathematical framework for navigating market behavior.


Leave a Reply