I view market price action not as a random walk of chaotic variables, but as a highly structured, living reflection of mass human psychology. When millions of participants interact, their collective optimism and pessimism organize into distinct, recognizable, and repeating geometric patterns. This is the foundational premise of the Elliott Wave Principle.
Discovered by Ralph Nelson Elliott in the 1930s, this theory posits that market behavior trends and reverses in recognizable patterns. When I approach a blank chart, I do not look for arbitrary support or resistance lines. Instead, I count the structural waves to determine exactly where the market currently resides within its broader psychological cycle.
The Core 5-3 Wave Cycle
The defining concept I use to map any chart is the complete 5-3 wave cycle. Every major market movement subdivides into an eight-wave sequence. This sequence consists of a five-wave motive phase followed by a three-wave corrective phase.
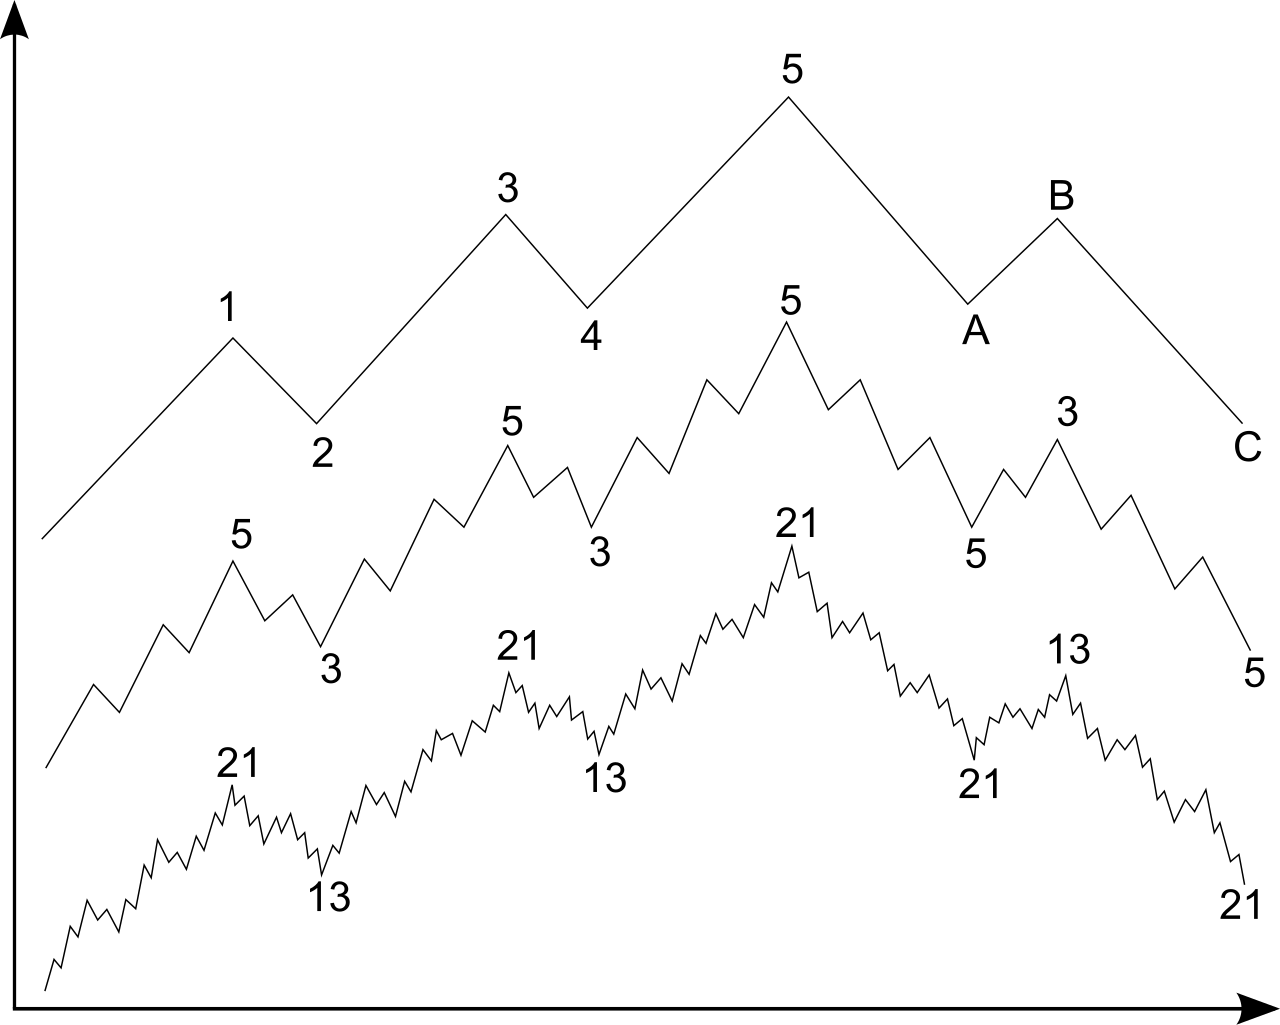
The motive phase (labeled 1, 2, 3, 4, and 5) propels the structure in the direction of the primary trend. Within this phase, waves 1, 3, and 5 do the heavy lifting of directional movement, while waves 2 and 4 serve as temporary pauses or minor retracements. Once this five-wave sequence concludes, the market requires consolidation. This triggers the corrective phase (labeled A, B, and C), which moves counter to the primary trend.
When I analyze a structure, finding this 5-3 completion is critical. It tells me that a full psychological cycle of expansion and contraction has concluded, and a new directional phase is preparing to unfold.
The Fractal Nature of Price Geometry
One of the most fascinating aspects of wave theory is its fractal geometry. A fractal is a mathematical shape that can be split into parts, each of which is a reduced-size copy of the whole. This means the 5-3 wave pattern occurs on all observation scales, from multi-decade macro cycles down to minute-by-minute fluctuations.

If I zoom in on Wave 1 of a macro motive structure, I will find that it is constructed of its own internal five-wave motive sequence. If I zoom in on Wave 2, I will find a three-wave A-B-C correction. This structural nesting is what allows me to maintain absolute context. I never look at a local price movement in isolation. I always ask myself how the micro structure fits into the macro degree.
How I Apply the Wave Principle
Understanding the theory is only half the equation. Applying it requires rigid discipline and objective measurement. Here is the exact methodology I follow when translating theory into structural analysis.
Step 1: Identifying the Dominant Degree
Before I map local price action, I zoom out. I identify the highest visible degree of trend to determine if the broader market is in a motive expansion or a corrective consolidation. This anchors my analysis and prevents me from getting lost in the micro noise.
Step 2: Validating the Axioms
As I begin counting the sub-waves, I ruthlessly apply the three immutable rules of impulse structures. If Wave 2 overlaps the origin of Wave 1, or if Wave 4 enters the price territory of Wave 1, my count is structurally invalid. I do not force a count to fit my bias. I let the geometric rules dictate the structure.
Step 3: Measuring with Fibonacci Proportions
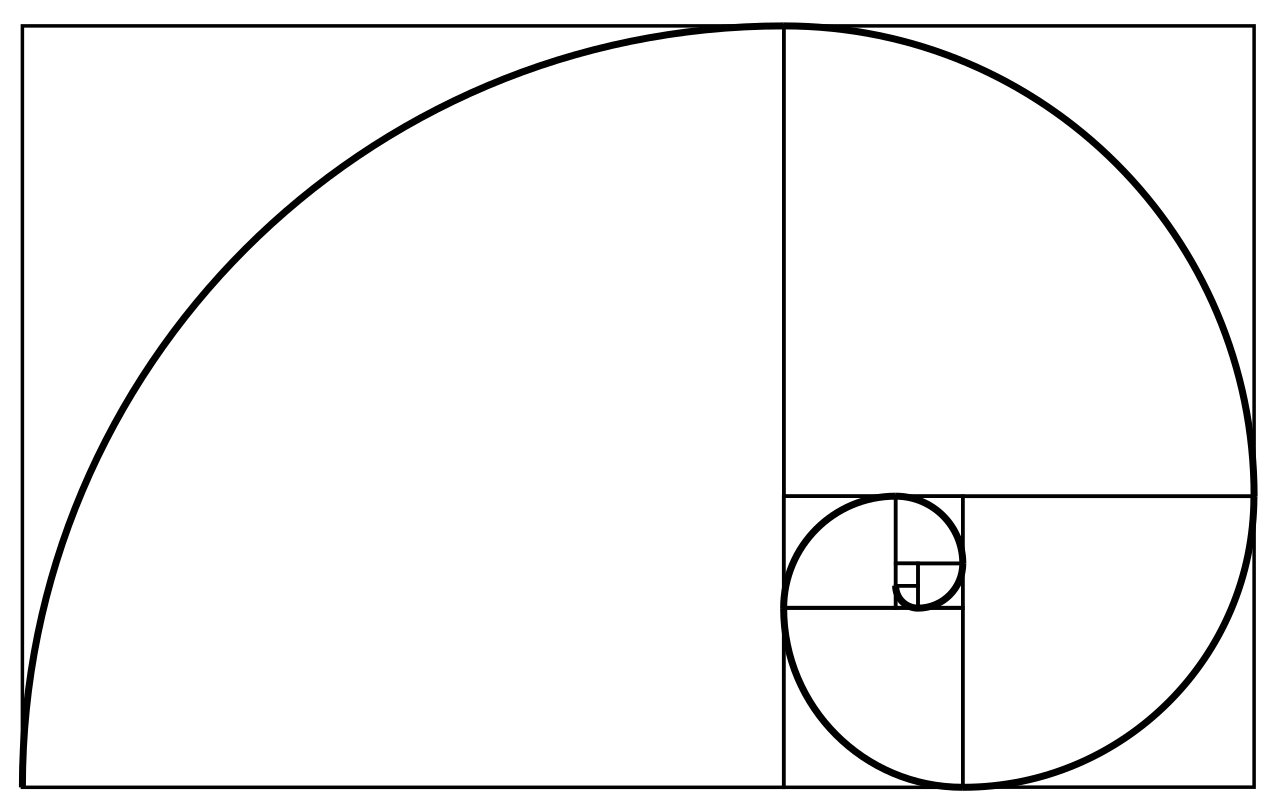
The Wave Principle is inextricably linked to the Fibonacci sequence and the Golden Ratio (1.618). I do not project wave terminations based on guesswork. I use Fibonacci extensions and retracements to calculate high-probability geometric targets.
For example, if I identify a completed Wave 1 and Wave 2, I project Wave 3 to reach the 1.618 extension of Wave 1. If I am analyzing a corrective Wave 2, I look for it to retrace mathematically proportional levels of Wave 1, such as the 0.500 or 0.618 ratios.
The Mindset of a Structural Analyst
Ultimately, I use the Elliott Wave Principle because it demands total objectivity. It strips away emotional bias and replaces it with mathematical probability. I do not predict what the market must do. I simply map the geometric structure as it unfolds, validating my counts against strict mathematical rules, and positioning my analysis on the right side of market psychology.


Leave a Reply