Most technical analysts confine their study of Fibonacci ratios to the vertical price axis, measuring retracements and extensions while treating time as an independent, passive background. In my structural framework, this approach ignores half of the geometric matrix. Space and time are fundamentally unified in market progression. Just as price amplitudes expand and contract in Golden Ratio proportions, the temporal intervals between significant market pivots adhere to Fibonacci sequence numbers and time-ratio extensions. When a verified Fibonacci price target coincides precisely with a Fibonacci time projection, the resulting Time and Price Confluence defines a multidimensional inflection node of the highest probability.
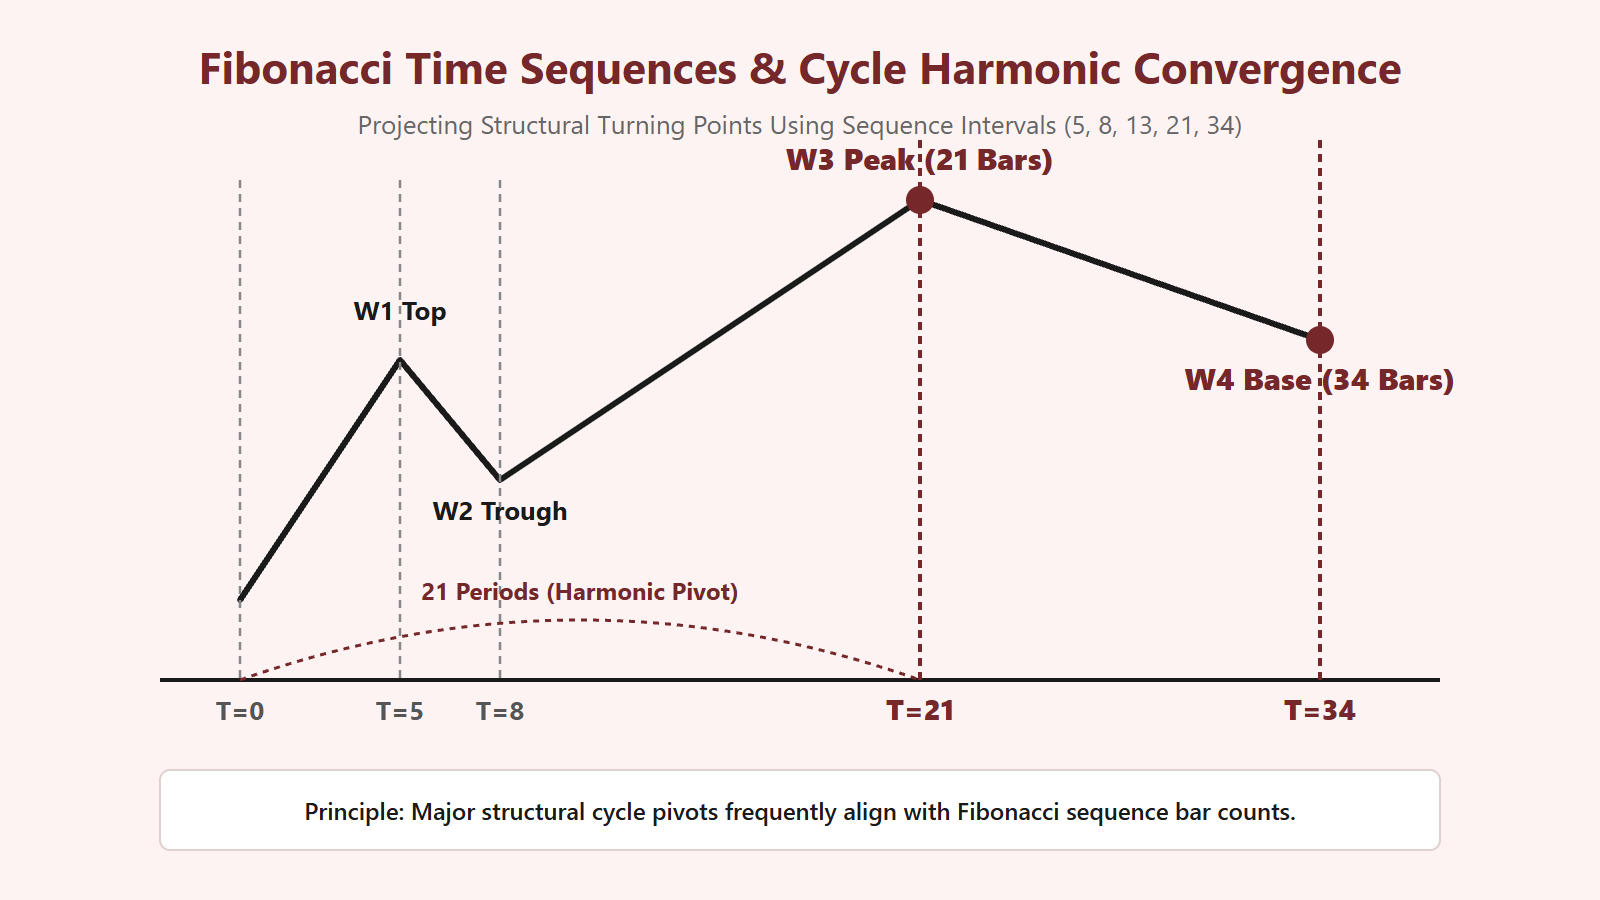
The Mechanics of Fibonacci Time Projections
To project temporal turning points, I employ two primary methodologies: Discrete Sequence Counting and Proportional Time Ratios.
1. Discrete Sequence Counting
In sequence counting, I identify an orthodox structural pivot (such as the major terminus of a cycle or the origin of Wave 1) and count forward using the integer series: 5, 8, 13, 21, 34, 55, 89, 144, 233, and 377 periods (whether on hourly, daily, or weekly timeframes). Remarkable structural alignment occurs when multiple independent sequence counts originating from different pivots converge on the exact same future date or bar:
- 34 bars forward from the major cycle low (Wave 0).
- 21 bars forward from the completion of Wave 1.
- 13 bars forward from the breakout point of Wave 3.
When three distinct sequence counts cluster within a window of 1 to 2 bars, a temporal vortex is created where market energy must resolve through a directional pivot.
2. Proportional Time Ratios
Rather than counting discrete integers, time ratio analysis measures the horizontal duration of a completed wave and projects proportional fractions or multiples forward from the subsequent pivot:
$$ ext{Duration}( ext{Correction}) = ext{Duration}( ext{Impulse}) imes 0.618 ext{ or } 1.000 ext{ or } 1.618$$
For example, if Wave 1 required 20 trading sessions to complete and Wave 2 is unfolding as a sideways flat, Wave 2 will frequently consume 12 sessions ($20 imes 0.618$) or 32 sessions ($20 imes 1.618$) before completing its final sub-wave. Time symmetry is just as mathematically prevalent as price symmetry.
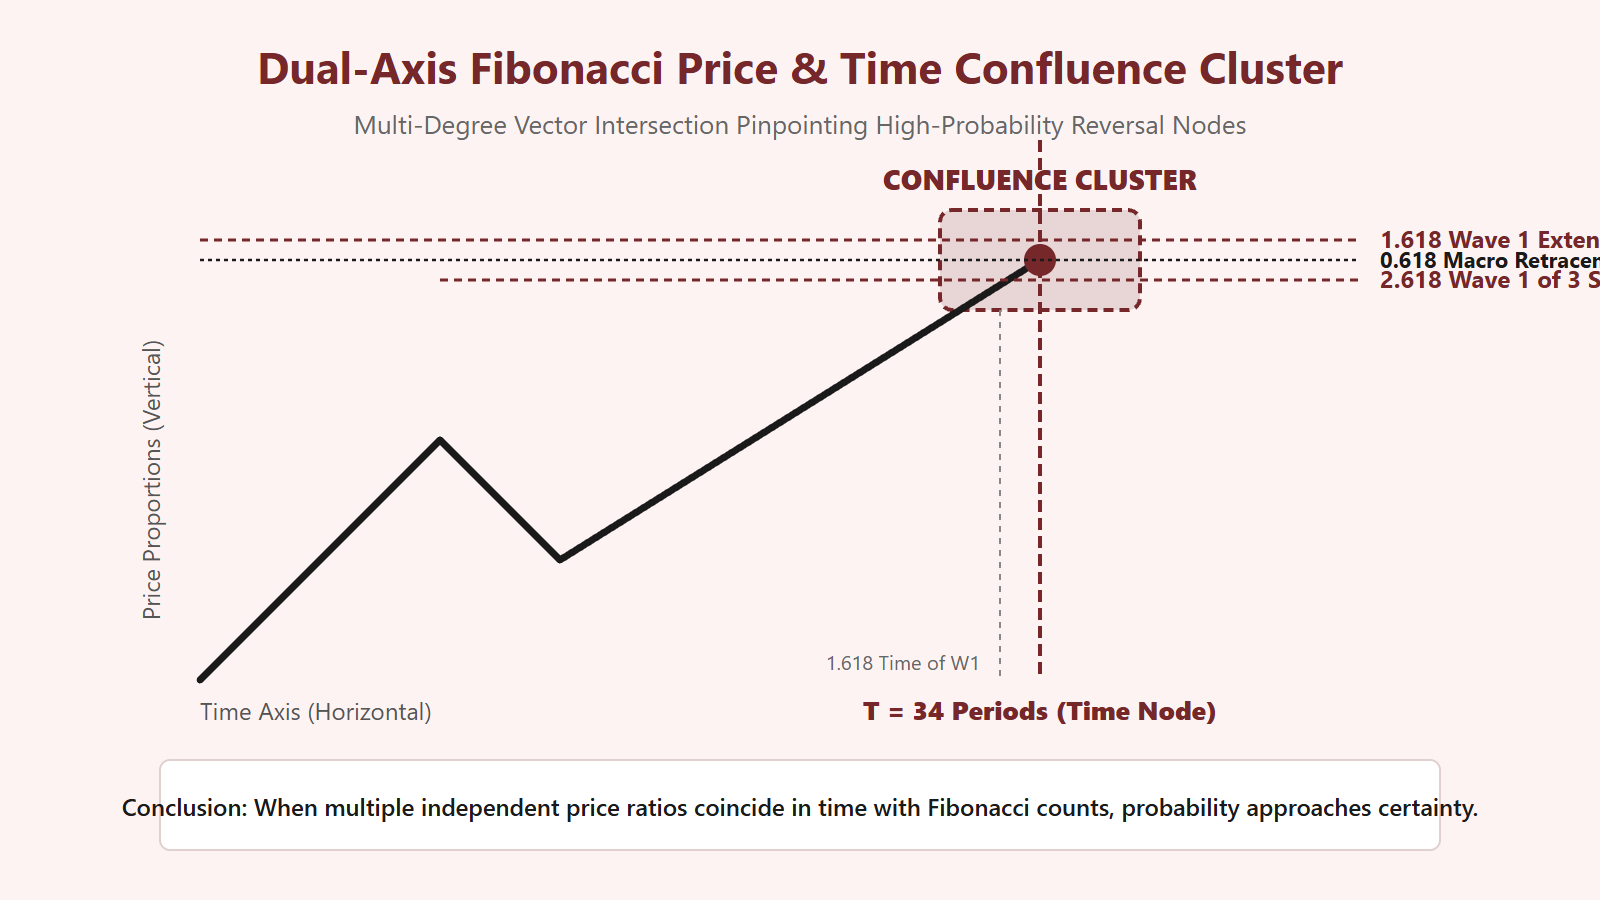
Constructing the Confluence Matrix
In professional wave forecasting, I never act upon a price level alone. Instead, I construct a two-dimensional grid where the vertical axis represents price geometry and the horizontal axis represents temporal duration:
- Vertical Vector (Price): Identify cluster levels where at least three independent Fibonacci price measurements align (e.g., a 0.618 retracement of Wave 1, a 1.618 extension of sub-wave A, and a 1.000 equality projection of Wave C).
- Horizontal Vector (Time): Identify date windows where at least two Fibonacci time counts or duration ratios intersect.
- Convergence Target: The intersection of these vectors defines a geometric coordinate box. If price arrives at the target price level before the time window arrives, the market is moving too rapidly and will likely blow through the level. If price arrives after the window has expired, momentum has decayed. True structural reversal occurs when price and time arrive simultaneously.
Psychological and Fractal Dynamics of Time Harmonics
Why do financial markets respect time cycles? The answer lies in the collective psychology of crowd behavior, which pulsates in rhythmic waves of optimism and pessimism. Mass sentiment does not change randomly; it undergoes harmonic oscillations that mirror natural biological and physical rhythms. The Fibonacci sequence governs these growth and decay cycles across all self-organizing systems.
Furthermore, because the market is fractal, time confluence operates recursively across degrees:
| Degree Level | Typical Time Window | Structural Impact |
|---|---|---|
| Minor Degree | 8 to 21 Hourly Bars | Intraday sub-wave completions and local momentum shifts. |
| Intermediate Degree | 21 to 55 Daily Bars | Multi-week wave terminations (completion of Waves 2, 4, or corrective zigzags). |
| Primary Degree | 55 to 144 Weekly Bars | Multi-year macroeconomic trend inflections and major secular cycle tops. |
Verification and Invalidation Rules
When price enters a confluence coordinate box, I look for immediate structural confirmation:
- The completion of the final fifth sub-wave of the terminating wave on lower degrees.
- Momentum divergence across standard oscillators (e.g., RSI or MACD) confirming velocity exhaustion at the exact time node.
- A sharp, impulsive rejection away from the confluence coordinate within 1 to 2 time periods.
If the time window passes and price continues moving impulsively without forming a reversal pattern, the confluence has failed. In wave theory, a failed time node indicates that trend velocity has accelerated into an extended state, requiring an immediate recalculation to the next major Fibonacci time interval (e.g., advancing from 34 bars to 55 bars).


Leave a Reply