Of all the mathematical proportions governing financial geometry, none is more celebrated, widely tracked, or structurally significant than the Golden Ratio: 0.618. Represented by the Greek letter Phi ($\Phi$), this divine proportion governs the growth spirals of galaxies, the phyllotaxis of plants, the architecture of the human anatomy, and the collective ebb and flow of financial markets. Within the Elliott Wave Principle, the supreme manifestation of this ratio occurs during the second wave of an impulse sequence. I treat the 0.618 Fibonacci level in Wave 2 as the ultimate mathematical springboard: the exact coordinate where fear exhausts itself and the explosive momentum of Wave 3 is ignited.
The Mathematics of the Divine Proportion
The Golden Ratio is the mathematical foundation of the entire Fibonacci sequence. When you divide any number in the sequence by the number immediately following it, the ratio converges asymptotically toward 0.6180339887… as the numbers expand toward infinity:
$$\lim_{n \to \infty} \frac{F_n}{F_{n+1}} = \frac{\sqrt{5} – 1}{2} \approx 0.618$$
Conversely, dividing any number by the preceding number yields its inverse: 1.618 (the Golden Mean). This mathematical relationship is unique in all of number theory: 1.618 and 0.618 share the exact same fractional mantissa, and each is the mathematical reciprocal of the other ($1 / 1.618 = 0.618$).
In market geometry, mass human psychology is a natural, organic phenomenon governed by the laws of recursive growth. When a crowd reacts to a structural price impulse, the natural amplitude of that emotional reaction does not dissipate arbitrarily; it retraces precisely 61.8% of the preceding expansion before reaching harmonic equilibrium.
Wave 2 Mechanics: The Psychological Trap
To understand why Wave 2 targets the 0.618 ratio with such astonishing regularity, one must examine the psychological transition occurring on the chart.
Wave 1 represents the initial trend reversal out of a major macro low. However, because the antecedent bear trend was prolonged and painful, market participants are conditioned to view every rally as a selling opportunity. When Wave 1 concludes, aggressive short-sellers and fearful dip-buyers rush to sell, driving price downward in a seemingly dominant counter-trend move.
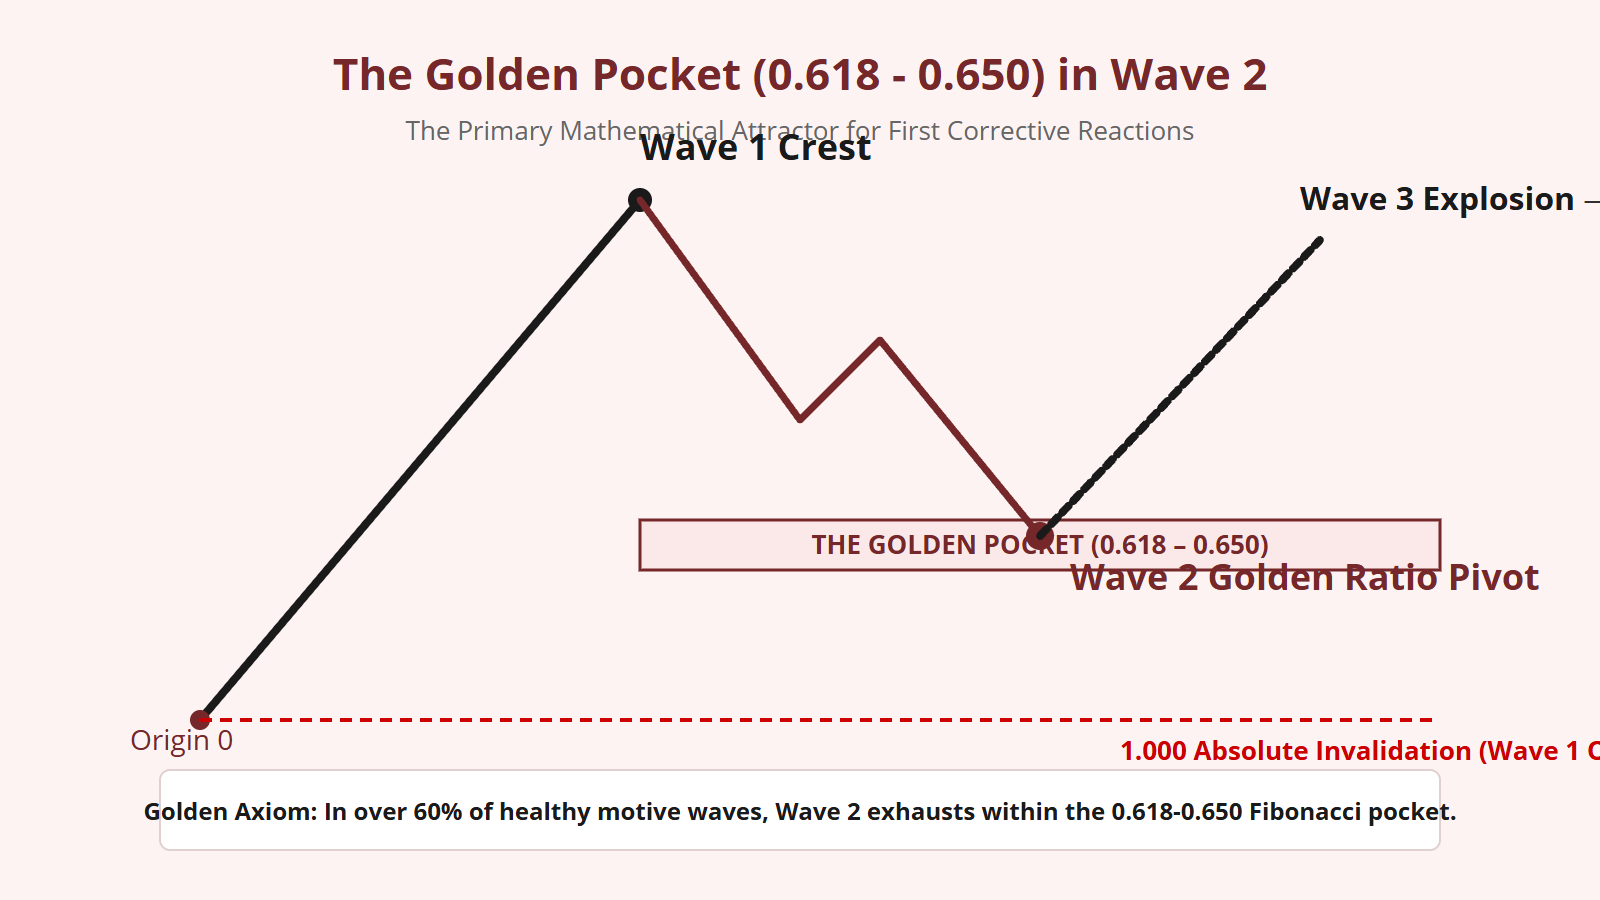
As price drops past 38.2% and 50%, bearish conviction reaches a crescendo. Conventional analysts proclaim that the market is heading to new lows. Yet as price enters the 0.618 Golden Pocket (0.618 to 0.650), the character of the order flow changes abruptly.
The selling volume dries up. The internal sub-waves of the corrective decline complete their five-wave [c] leg. Institutional accumulators, recognizing the mathematical discount, step in with massive liquidity. The market halts at 0.618, traps the late short-sellers, and reverses violently to launch Wave 3.
The Golden Pocket: 0.618 to 0.650
In modern quantitative charting, the 0.618 level is rarely treated as an isolated, microscopic price line. Instead, it is evaluated as a narrow, high-probability harmonic band known as the Golden Pocket, spanning between 0.618 and 0.650.
Where does the 0.650 ratio come from? The 0.650 coordinate represents the exact mathematical midpoint between 0.618 and the secondary 0.682 harmonic retracement. In practical market dynamics, high-frequency algorithms frequently push price slightly past the nominal 0.618 line to trigger stop-loss orders resting directly below the textbook level, sweeping liquidity down to 0.650 before reversing.
When mapping Wave 2, I mark the 0.618-0.650 zone as a shaded geometric box. As long as price closes within or above this pocket—and does not violate the 1.000 origin line—the bullish impulse structure remains completely intact.
Confluence: Wave C = Wave A Equality at 0.618
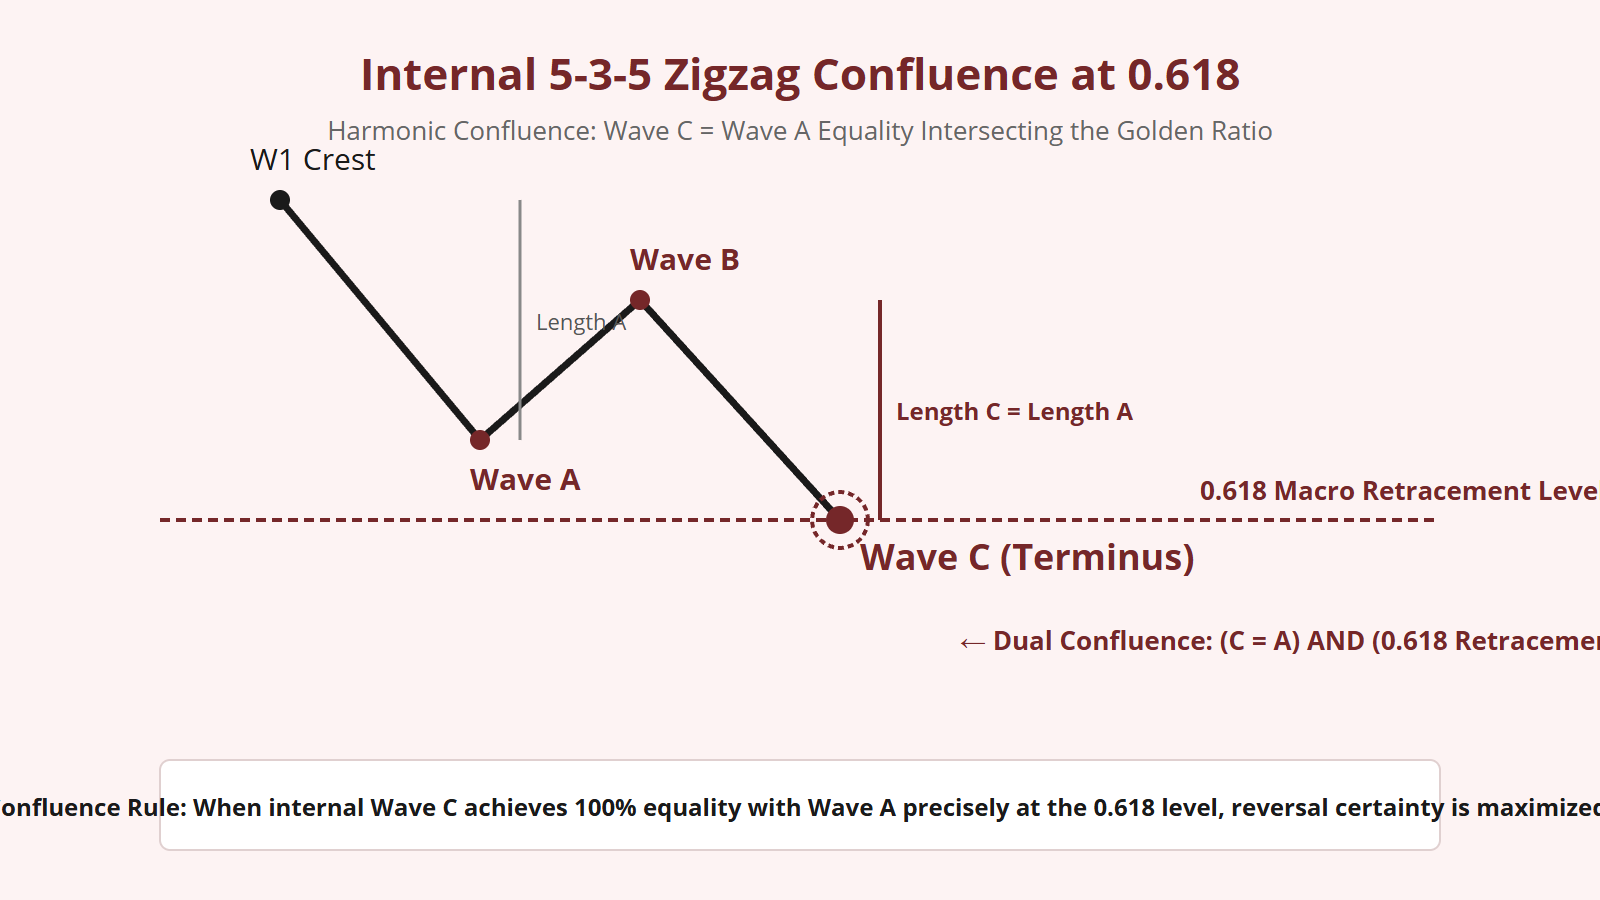
The single most powerful setup in all of Elliott Wave theory is the convergence of the 0.618 retracement with internal corrective equality ($C = A$).
Wave 2 almost universally subdivides as a sharp 5-3-5 Zigzag. Within that zigzag:
- Wave A executes the first impulsive five-wave drop.
- Wave B executes a three-wave counter-rally.
- Wave C executes the final five-wave drop.
When I project the length of Wave A downward from the peak of Wave B, I calculate the coordinate where Wave C equals 100% of Wave A ($C = 1.000 imes A$).
In a textbook setup, the price coordinate where $C = A$ aligns exactly at the 0.618 retracement of Wave 1! When internal structural equality ($C = A$) intersects the macro Fibonacci Golden Ratio (0.618) within a few ticks, the mathematical confluence is undeniable. This is where high-conviction structural reversals occur.
Execution Protocol: Capitalizing on the Golden Ratio
To execute objective analysis around the 0.618 Wave 2 level, I adhere strictly to these non-negotiable rules:
- Verify Wave 1 Origin Baseline: Confirm the exact price low where Wave 1 began. This is Coordinate 0.0. Under Cardinal Law 1, Wave 2 can NEVER breach this origin.
- Measure Wave 1 Point Span: Calculate the exact vertical distance of Wave 1 and compute the 0.618 retracement coordinate:
$$\text{0.618 Level} = \text{Wave 1 Crest} – (\text{Length of Wave 1} \times 0.618)$$ - Cross-Reference Internal Sub-Waves: Ensure that Wave 2 is completing its sub-wave [v] of C as it enters the 0.618-0.650 pocket.
- Define Invalidation Mathematically: Your structural invalidation is anchored unequivocally below the Wave 1 origin. This provides an unmatched geometric risk-to-reward ratio for anticipating the third wave.
The 0.618 Golden Ratio is the mathematical heartbeat of the Elliott Wave Principle. When you align your analysis with its harmonic pull, the noise of market pullbacks resolves into geometric perfection.


Leave a Reply