While classical contracting triangles feature two converging boundary trendlines that both possess an angle of slope, market geometry frequently constructs a powerful hybrid: the Barrier Triangle. In a Barrier Triangle, one boundary trendline forms a perfectly flat, horizontal line connecting two structural extremes, while the opposing boundary slopes aggressively toward it. This creates the classical ascending or descending triangle geometry within the strict 3-3-3-3-3 framework of Elliott Wave theory. In my analytical work, a Barrier Triangle provides exceptional directional clarity: the flat horizontal barrier reveals an area of massive structural absorption, while the sloping boundary demonstrates persistent directional accumulation.
The Geometry of Horizontal Absorption
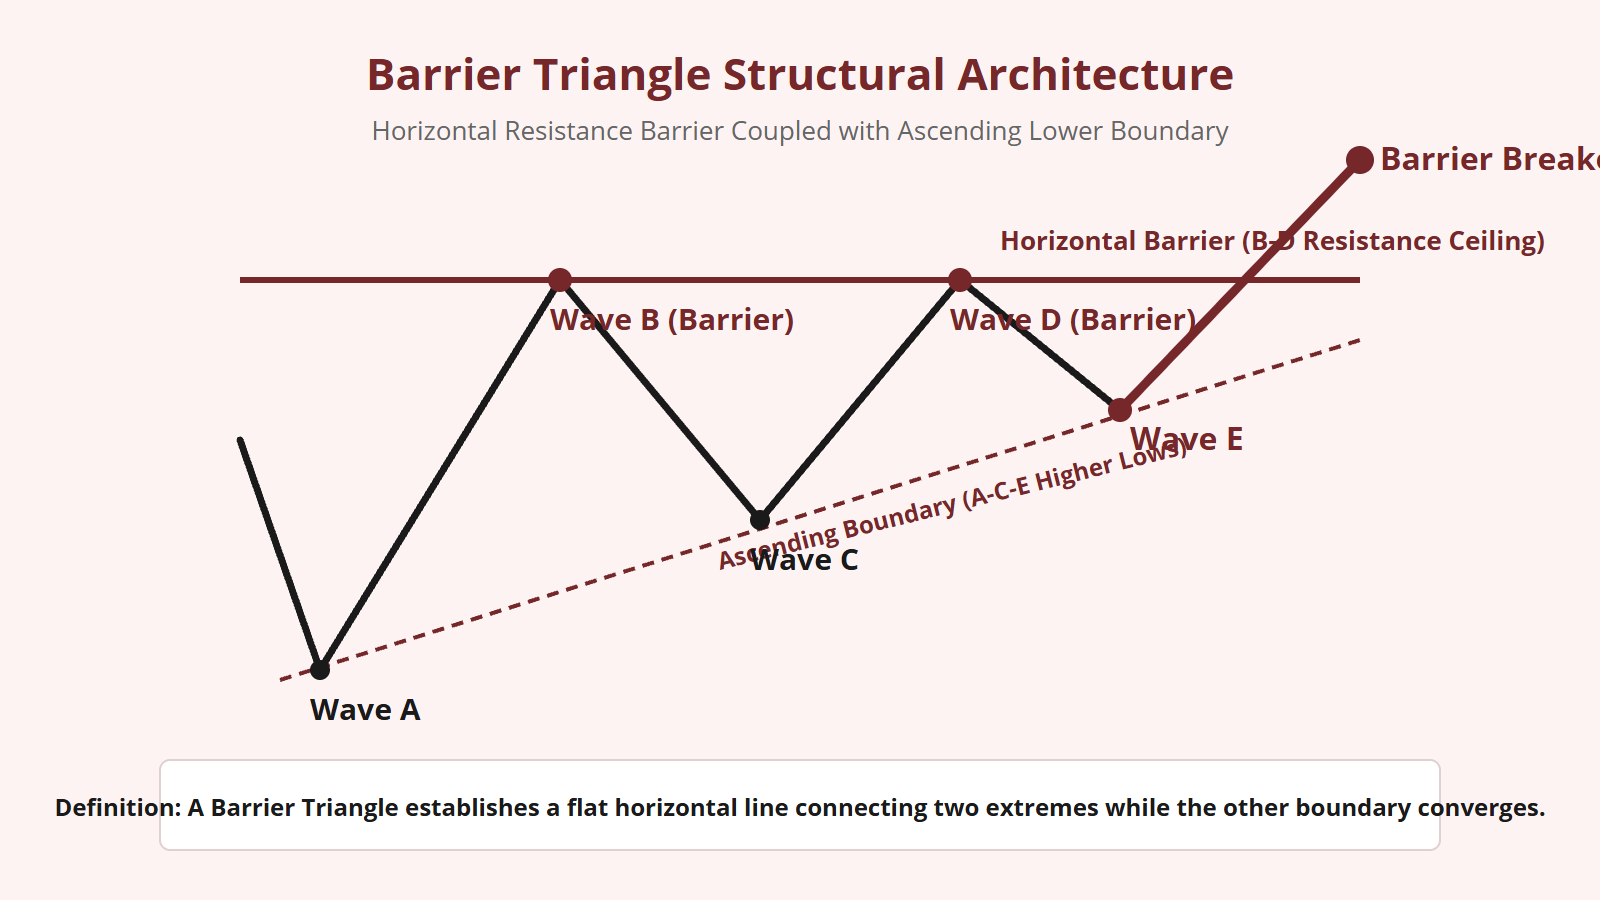
A Barrier Triangle occurs when one side of the market establishes an immovable structural wall. In a bullish continuation setup (an ascending barrier triangle):
- Wave B rallies to a specific price level and halts.
- Wave C executes a shallow 3-wave pullback, terminating far above the Wave A low.
- Wave D rallies back to the exact horizontal level established by Wave B, creating a double-top appearance.
- Wave E pulls back in a very shallow swing, establishing another higher low along an ascending trendline.
Connecting the peaks of Wave B and Wave D creates a perfectly flat, horizontal resistance line—the Barrier. Meanwhile, connecting the troughs of Waves A, C, and E produces an ascending lower trendline.
This geometric asymmetry tells a profound story: sellers are defending a specific price ceiling with large limit orders, but buyers are becoming increasingly aggressive on every dip, refusing to let price retrace deeply. The horizontal barrier is systematically absorbing all available supply, preparing the market for a decisive breakout.
Ascending vs. Descending Barrier Triangles
Barrier Triangles manifest in two distinct geometric orientations, depending on whether the horizontal line functions as resistance or support:
1. Ascending Barrier Triangle (Bullish Continuation): Features a horizontal upper barrier (connecting B and D) and an ascending lower boundary (connecting A, C, and E). It occurs predominantly in Wave 4 of an upward impulse or Wave B of a corrective rally. The ascending higher lows prove that buying conviction is building, making an upward breakout through the horizontal ceiling the overwhelmingly probable outcome.
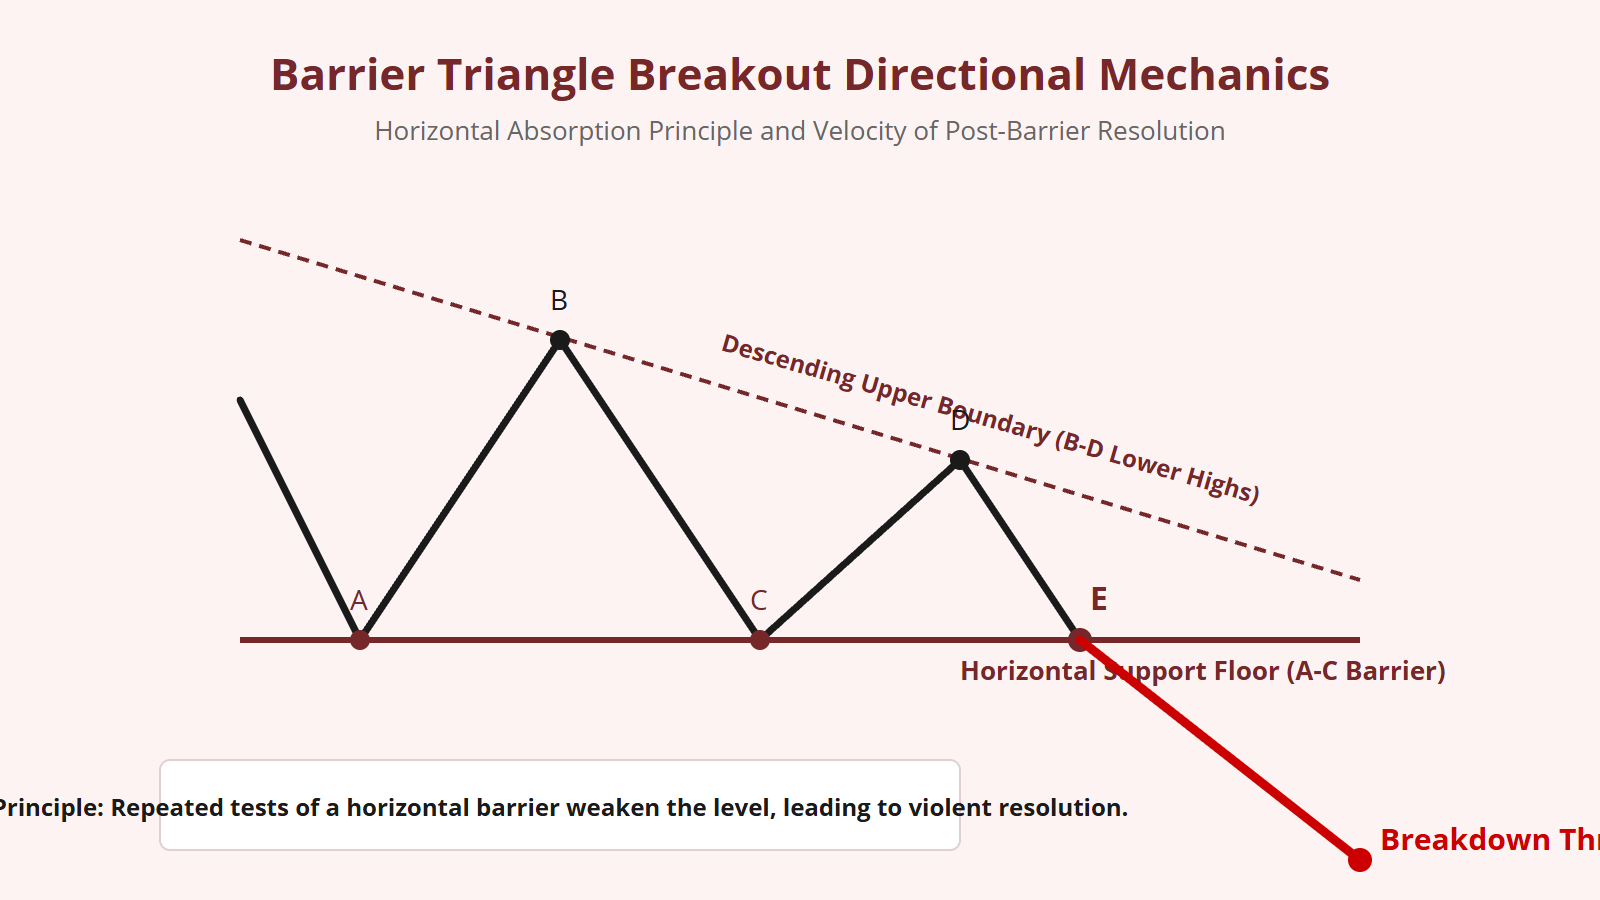
2. Descending Barrier Triangle (Bearish Continuation): Features a horizontal lower barrier (connecting A and C, or B and D in specific wave degrees) and a descending upper boundary. Sellers are pressing price into lower highs against a flat support floor. The repeated tests of horizontal support exhaust all buying orders, culminating in an aggressive downward breakdown thrust.
Internal Rules: Preserving the 3-3-3-3-3 Formula
To avoid confusing a classical retail pattern with an authentic Elliott Wave Barrier Triangle, an analyst must strictly enforce wave mechanics rules:
- All Five Legs Must Be Corrective: Waves A, B, C, D, and E must all subdivide into 3-wave internal structures (a-b-c). An impulse wave cannot exist as an entire primary leg.
- Precision of the Horizontal Barrier: The two touchpoints that form the barrier (typically B and D) must terminate at virtually identical price coordinates. A variance of more than a few ticks indicates that the structure is a standard contracting triangle with a tilted axis, rather than a true barrier triangle.
- Wave E Termination: Wave E must terminate cleanly before touching the apex where the horizontal barrier meets the sloping trendline. It must respect the ascending (or descending) boundary line without violating the prior structural extreme.
Breakout Velocity and the Absorption Principle
One of the unique advantages of a Barrier Triangle compared to a standard symmetrical triangle is the velocity of its post-triangle thrust. In a symmetrical triangle, price breaks out through a sloping trendline, often leading to a measured, steady expansion.
In a Barrier Triangle, the breakout occurs through a flat, horizontal level that has been tested repeatedly. Because that level was defended so heavily, large clusters of structural stop-orders accumulate directly behind the barrier.
The moment price breaks through the horizontal line, two explosive forces combine: aggressive breakout momentum enters the market, and trapped counter-trend participants are forced to cover their positions. This creates an instantaneous surge in volume and velocity, launching the post-triangle thrust in a near-vertical trajectory.
Execution Guidelines: Trading the Barrier Thrust
To capture the high-velocity breakout of a Barrier Triangle with mathematical precision, follow this execution protocol:
- Confirm the Second Barrier Touchpoint: Once Wave D touches the horizontal level established by Wave B and begins to reverse, the barrier structure is formally recognized.
- Project the Wave E Touchpoint: Draw your sloping trendline through Waves A and C. Anticipate the completion of Wave E where price intersects this ascending trendline.
- Measure the Projected Thrust: Measure the vertical height of the triangle base (from the Wave A low to the horizontal barrier). That exact distance is your minimum target projection once the barrier is breached.
- Set Precise Invalidation: Place your structural invalidation level directly beneath the low of Wave E. If price falls below the Wave E pivot, the barrier setup is mathematically invalidated.
The Barrier Triangle combines the geometric discipline of Elliott Wave theory with the undeniable power of horizontal order flow absorption, offering one of the most reliable continuation patterns in all of technical analysis.


Leave a Reply