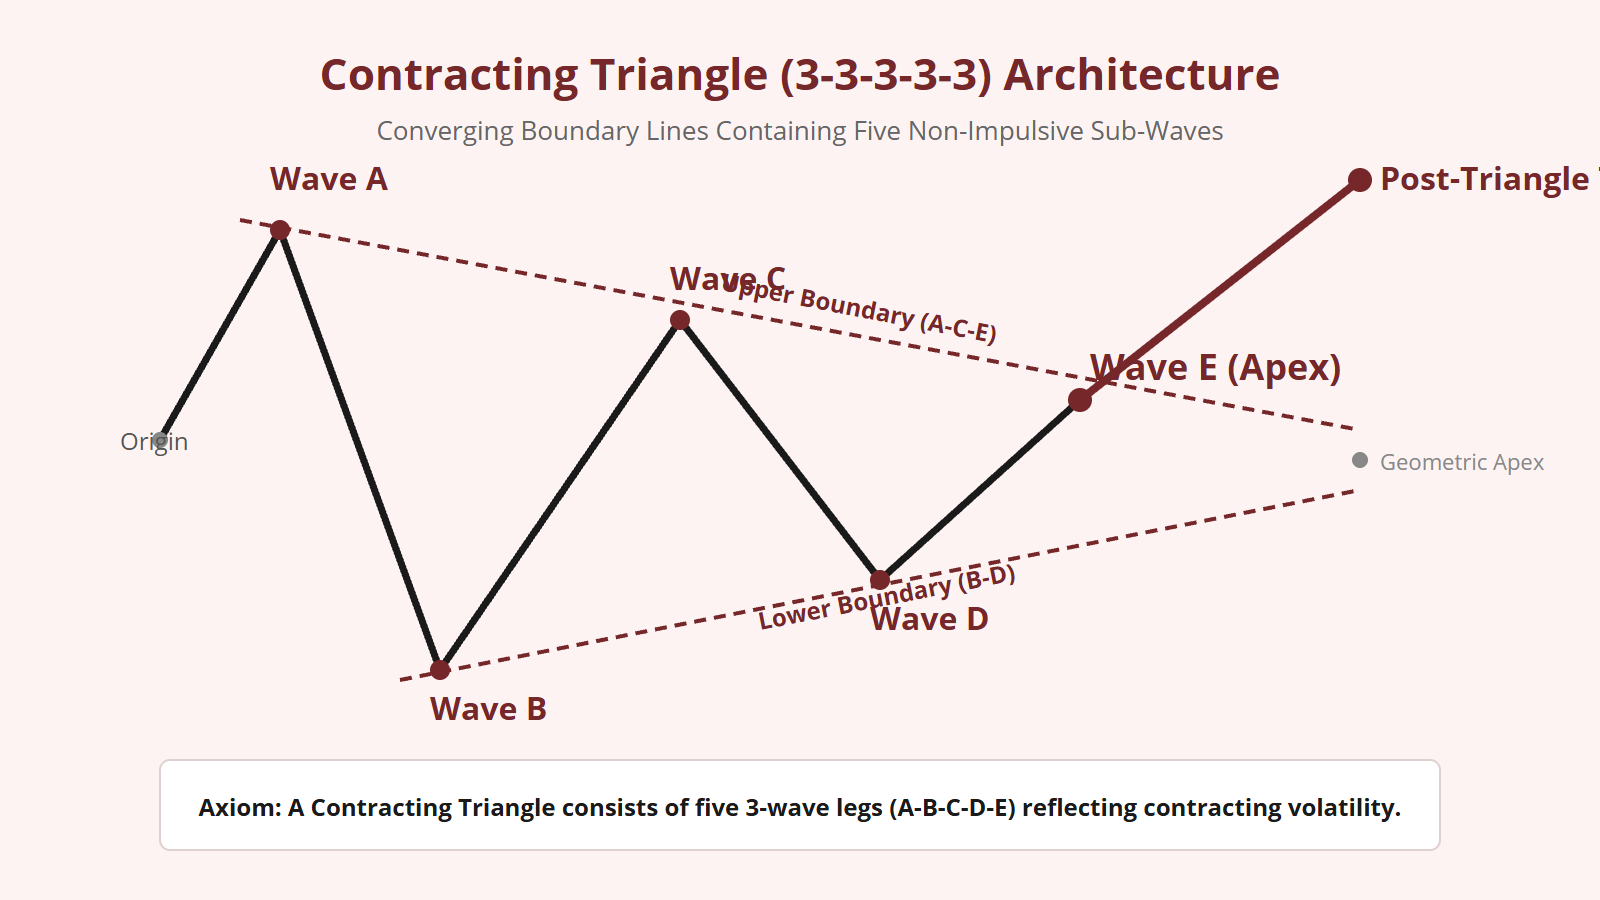
When market participants enter an extended phase of structural indecision, price energy does not dissipate into random noise. Instead, it coils into one of the most mathematically elegant patterns in all of technical geometry: the Contracting Triangle. Bound between converging upper and lower boundary trendlines, a Contracting Triangle reflects a progressive decay in volatility, amplitude, and momentum. It is constructed from five non-impulsive legs, labeled A-B-C-D-E, each adhering strictly to a 3-wave internal subdivision. In my analytical practice, mapping a Contracting Triangle is an exercise in measuring harmonic compression before an explosive terminal thrust.
The Mechanics of Volatility Compression
The Contracting Triangle is the purest visual manifestation of a market coiling under geometric tension. In trending motive phases, price moves directionally with expanding amplitude. However, when the market reaches the penultimate phase of a larger structural sequence (such as Wave 4 or Wave B), buying and selling forces achieve temporary parity.
Each successive swing fails to reach the amplitude of the previous swing. Sellers step in at lower highs, while buyers step in at higher lows. This mutual compression narrows the operational price range toward a definitive geometric apex. When I plot the boundary trendlines across the price swings, the lines converge toward each other, forming a symmetrical or asymmetrical wedge.
Crucially, this decay in price amplitude is accompanied by a severe contraction in structural volume and momentum. By the time price approaches the terminal pivot of Wave E, the market has reached an extreme state of structural equilibrium, preparing for an explosive release of stored kinetic energy.
Deconstructing the 3-3-3-3-3 Internal Architecture
Every pattern within the Elliott Wave Principle is defined by its internal formula. For a Contracting Triangle, that formula is unequivocally 3-3-3-3-3. Unlike an impulse wave that contains five waves with three motive subdivisions (5-3-5-3-5), a triangle contains five waves where every single leg is corrective.
Let us examine the structural requirements of each sub-wave:
- Wave A: Unfolds as an a-b-c corrective zigzag or flat. It establishes the widest part of the triangle (the base).
- Wave B: Unfolds as an a-b-c corrective structure. It terminates below the origin of Wave A, establishing the first upper boundary coordinate.
- Wave C: Subdivides into three waves (a-b-c). It terminates above the low of Wave A, establishing the first higher low.
- Wave D: Subdivides into three waves (a-b-c). It terminates below the peak of Wave B, creating a lower high.
- Wave E: The terminal leg of the triangle. It subdivides into three waves (a-b-c). Wave E terminates above the low of Wave C, completing the five-wave contracting series. In many instances, Wave E will briefly overshoot or undershoot the A-C boundary trendline, creating a false break before the true thrust initiates.
If even a single leg within the A-B-C-D-E sequence subdivides as an unambiguous five-wave impulse, the pattern is NOT a valid triangle. Every component must be non-impulsive.
Fibonacci Mathematics: The 0.618 Harmonic Decay
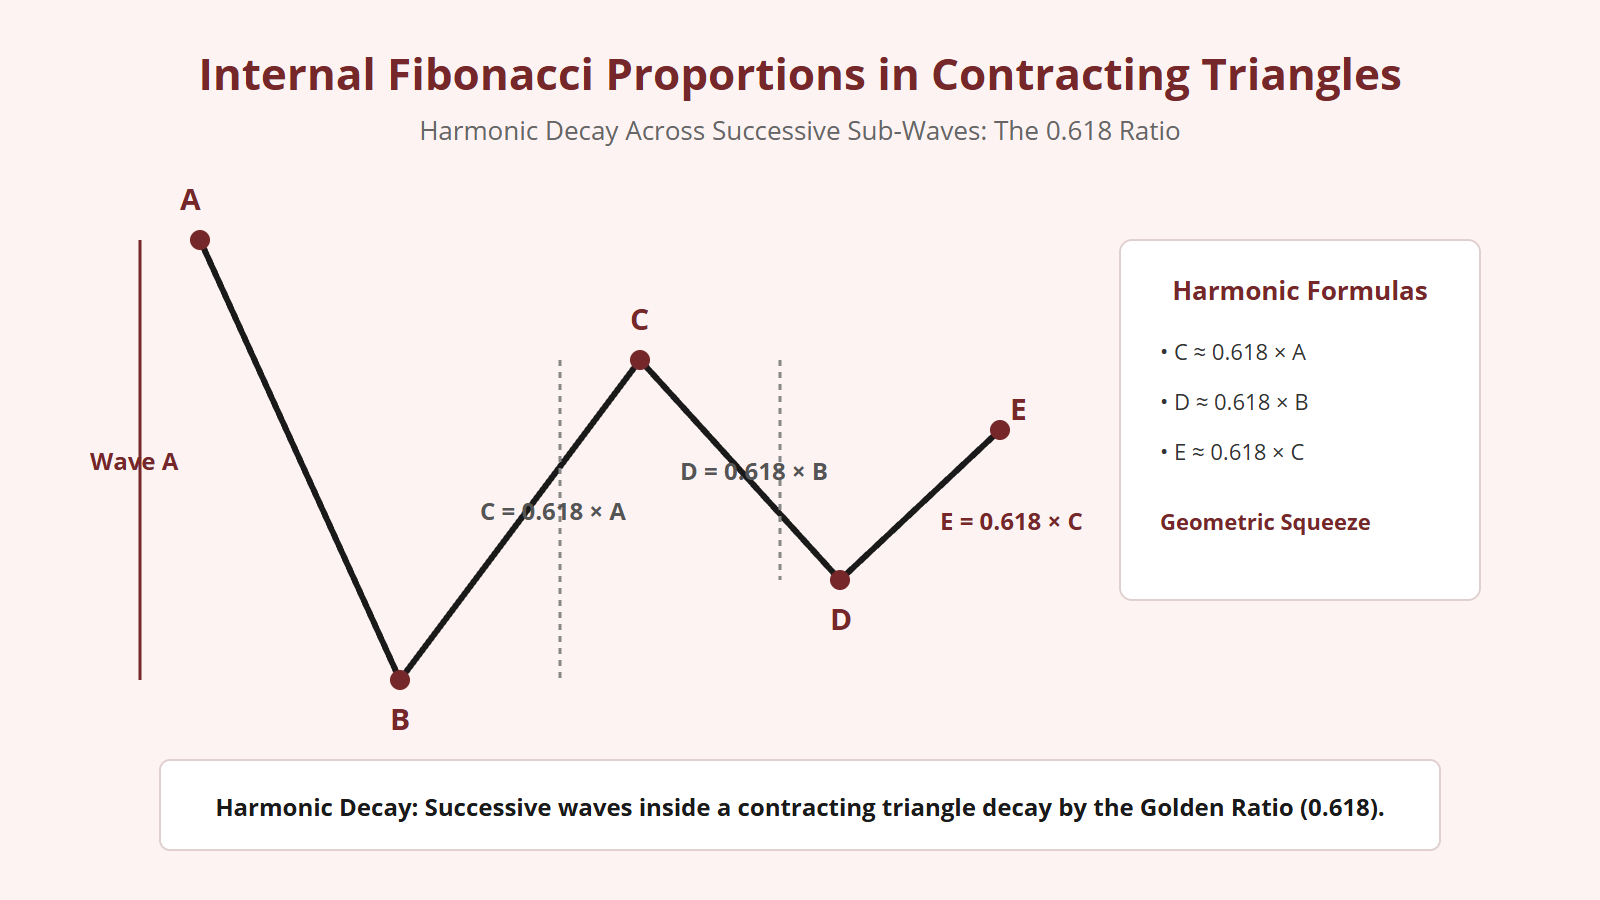
What makes the Contracting Triangle mathematically captivating is that the contraction in amplitude is rarely arbitrary. In my charting case studies, successive alternating waves frequently relate to each other through the Golden Ratio ($\Phi = 0.618$) or its secondary harmonic ($0.786$):
Wave D ≈ Wave B × 0.618 (or 0.786)
Wave E ≈ Wave C × 0.618 (or 0.786)
This mathematical decay reflects the exact geometric scaling observed in logarithmic spirals. When you calculate the Fibonacci ratios of alternating legs, you can forecast the exact termination coordinate of Wave E with extraordinary precision, long before the market reaches that level.
The Guideline of the Apex Intersection
When I project the upper boundary line (connecting peaks A and C) and the lower boundary line (connecting troughs B and D) into the future, they intersect at a single coordinate in price and time known as the Geometric Apex.
Elliott observed a critical timing guideline regarding this apex: Wave E almost always terminates before the boundary lines intersect at the apex. In optimal market geometry, Wave E concludes approximately 60% to 75% of the distance from the base of the triangle to the apex.
If price continues to drift aimlessly past the apex point, the pattern loses its coiled structural tension. When a market crawls beyond the apex without initiating an aggressive breakout, the triangle hypothesis is invalidated, indicating that the market has morphed into a complex horizontal combination rather than a true triangle.
Actionable Rules for Confirming Triangle Completion
To safely navigate a developing Contracting Triangle and position for the impending thrust, I adhere to these operational disciplines:
- Never Anticipate on Wave C or D: Inexperienced analysts frequently jump into a trade during Wave C, assuming the triangle is finished. A valid triangle requires all five legs (A through E). Premature entries during Wave C or D lead directly to being chopped up inside the contracting consolidation.
- Monitor Wave E for False Breaks: Expect Wave E to test the A-C trendline. A slight piercing (throw-over) followed by an immediate reversal back inside the converging channel is the classic signal that Wave E has terminated.
- Set Invalidation at the Wave D Extreme: Once Wave E turns, the structural invalidation level for the post-triangle thrust is the extreme established by Wave D. A breach of Wave D in the counter-trend direction immediately invalidates the setup.
Mastering the Contracting Triangle provides unmatched structural insight: it allows an analyst to recognize when a consolidation has completed its mathematical cycle and prepare for the explosive thrust that inevitably follows.


Leave a Reply