In the entire lexicon of market geometry, no pattern generates more kinetic power, structural volume, and price distance than Wave 3. When I analyze an impulse sequence, Wave 3 is the engine of the entire trend. It represents the phase where collective market psychology awakens to reality: the prior trend is dead, the structural shift is undeniable, and capital floods the market in a relentless wave of directional urgency. To map Wave 3 with precision, an analyst must understand Fibonacci trend-based extensions, internal degree nesting, and the inviolable Cardinal Law that governs its minimum length.
The Kinetic Power of the Third Wave
Wave 3 is the centerpiece of motive wave mechanics. Unlike Wave 1, which struggles against lingering disbelief, and Wave 5, which battles structural exhaustion, Wave 3 operates in an environment of total geometric alignment. Fundamental narratives, quantitative algorithms, and mass human sentiment converge into a singular directional vector.
On a price chart, Wave 3 is immediately recognizable by its visual velocity. The slope of the price action steepens dramatically, price bars expand in range, and pullbacks during its progression are shallow, brief, and aggressively bought or sold. Gaps frequently appear across price space—often referred to as breakaway or runaway gaps—signifying an extreme imbalance between aggressive market participants and structural resistance.
In my analytical practice, my primary objective when tracking a developing five-wave impulse is to identify the onset of Wave 3, because it offers the highest probability of sustained, directional geometric expansion.
Cardinal Law 2: Wave 3 is Never the Shortest
The second Cardinal Law of the Elliott Wave Principle is one of the most frequently misunderstood rules in structural charting:
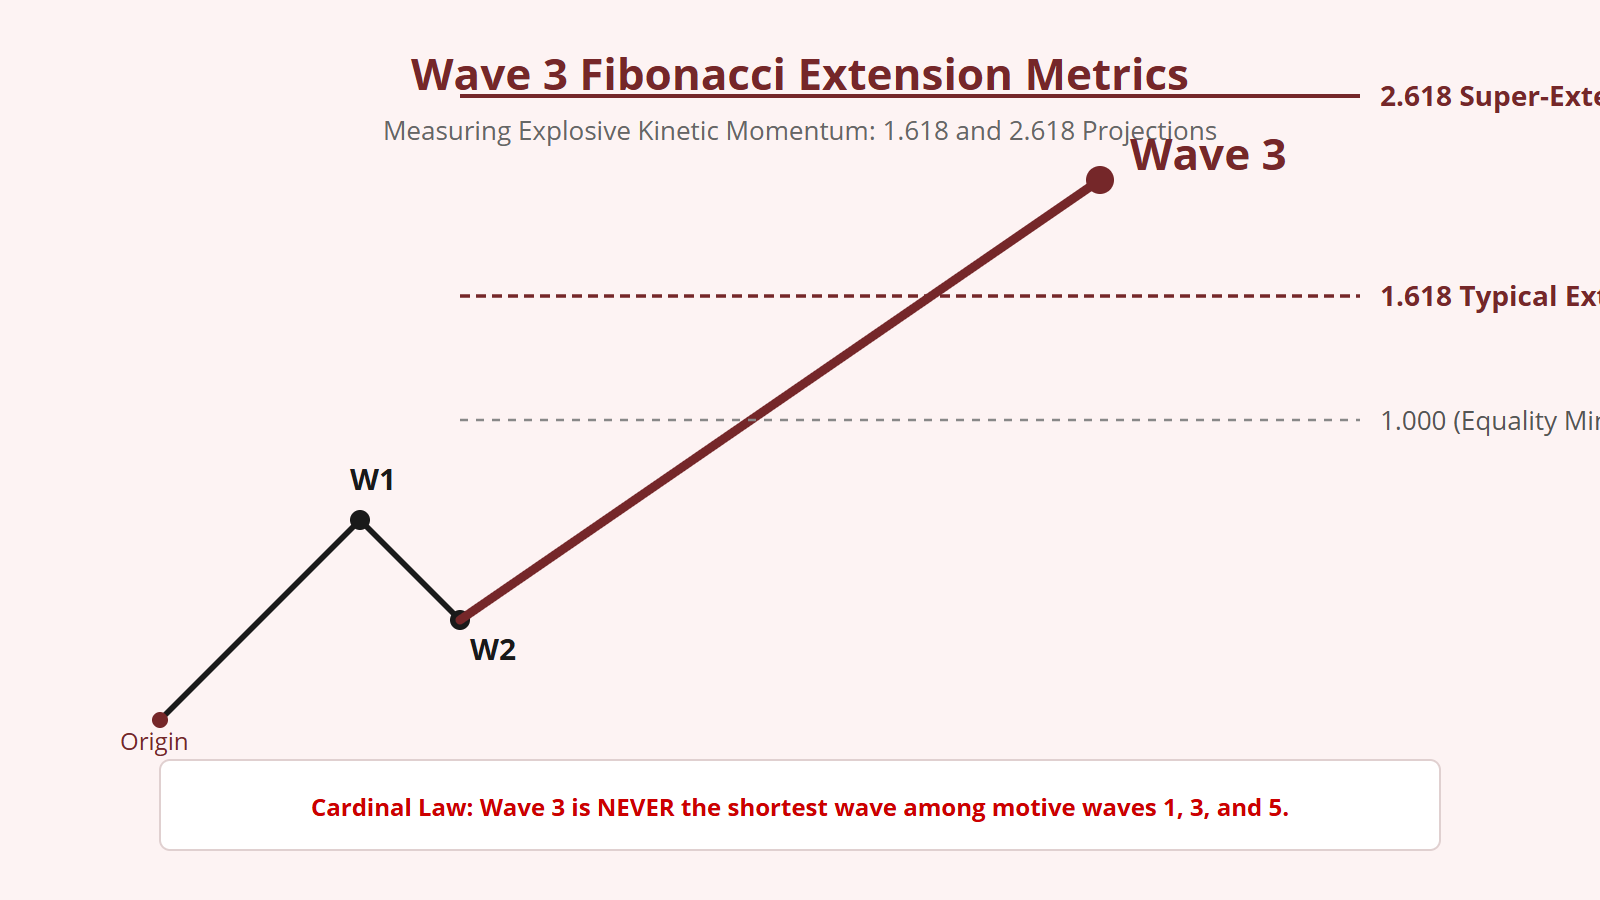
Notice what this rule explicitly states: Wave 3 does not necessarily have to be the longest wave in every single instance (though it is the longest in the vast majority of cases); it simply cannot be the shortest. If Wave 1 measures 100 points, Wave 3 measures 80 points, and Wave 5 measures 90 points, the wave count is mathematically false. Wave 3 was shorter than both Wave 1 and Wave 5, violating the fundamental physics of the Elliott Wave system.
Whenever I construct an impulse hypothesis, I constantly verify that the vertical point length of Wave 3 exceeds at least one of the other two motive legs. If Wave 3 is shorter than Wave 1, Wave 5 is mathematically capped: it cannot exceed the length of Wave 3.
Fibonacci Extension Targets for Wave 3
Wave 3 is the classic “extended wave” in almost all liquid market environments. To project the terminal target zone for Wave 3, I apply trend-based Fibonacci extensions using the length of Wave 1 projected upward from the verified termination low of Wave 2.
The mathematical projection levels I track include:
- 1.000 Extension (Structural Equality): The absolute minimum length for a standard Wave 3. If Wave 3 fails to achieve equality with Wave 1 ($W3 < 1.000 imes W1$), the structure is either a leading diagonal or a corrective combination rather than a standard impulse.
- 1.618 Extension (The Standard Textbook Target): In standard motive sequences, Wave 3 reaches precisely the 1.618 Fibonacci extension of Wave 1. This is the baseline mathematical benchmark for an extended third wave.
- 2.618 Extension (Super-Extension): In powerful parabolic markets driven by aggressive institutional momentum, Wave 3 frequently expands to 2.618 of Wave 1, creating a historic structural extension that dwarfs the first wave.
- 3.618 to 4.236 Extensions (Extreme Blow-Off): In rare, hyper-extended scenarios, Wave 3 reaches 3.618 or 4.236 times the length of Wave 1. When Wave 3 reaches these astronomical levels, it completely consumes the cycle’s psychological capital, virtually guaranteeing that Wave 5 will suffer a truncation or shallow compression.
The Epicenter: Wave 3 of 3
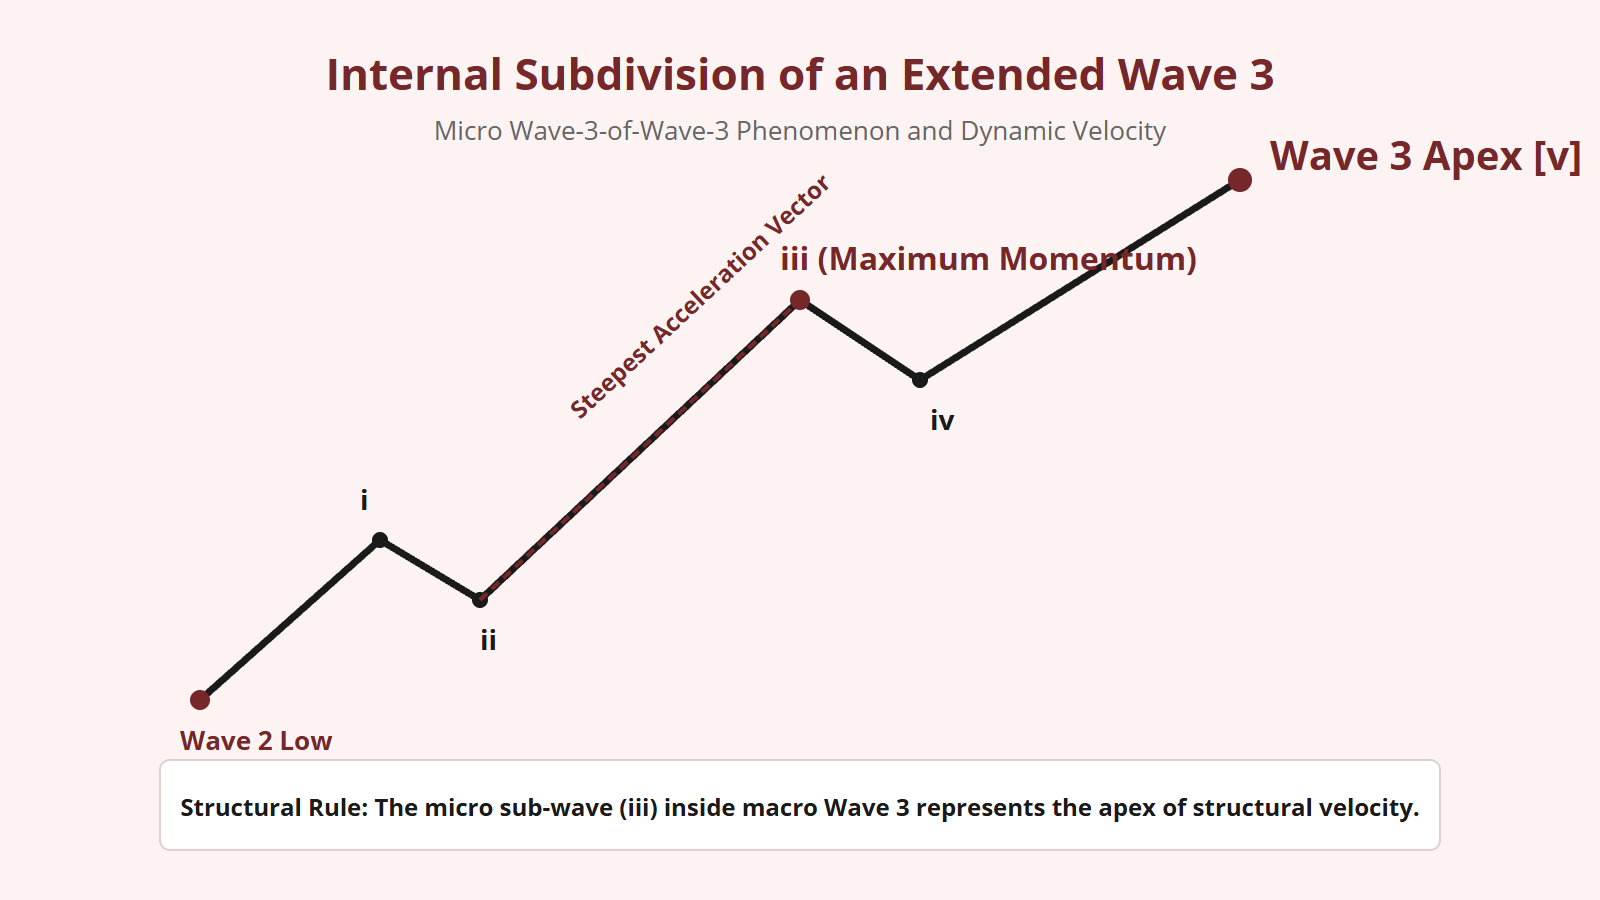
The most fascinating geometric phenomenon inside a developing third wave is the principle of recursive fractal nesting. Because Wave 3 is a motive wave, it subdivides internally into five sub-waves: (i)-(ii)-(iii)-(iv)-(v). Within that subdivision, sub-wave (iii) also subdivides into five micro-waves: 1-2-3-4-5.
This creates a nesting sequence known as Wave 3 of Wave 3. This coordinate represents the absolute epicenter of structural velocity in the entire market cycle. When sub-wave (iii) of Wave 3 is active:
- Momentum oscillators reach their highest recorded readings of the entire trend.
- Volume surges to its cyclical maximum.
- Price moves nearly vertically with zero counter-trend pullbacks.
Identifying Wave 3 of 3 prevents analysts from stepping in front of a freight train. Novice chartists frequently mistake the vertical acceleration of Wave 3 of 3 for a terminal market top, attempting to pick an exhaustion pivot prematurely. As an experienced structural analyst, I know that when Wave 3 of 3 is active, the trend is nowhere near its conclusion.
Analytical Rules for Riding the Third Wave
To successfully map and navigate Wave 3 environments, I adhere strictly to these operational disciplines:
- Never Counter-Trend Wave 3: Attempting to anticipate pullbacks during an active third wave is structural suicide. Counter-trend pullbacks in Wave 3 are notoriously shallow (often retracing less than 23.6%) and resolve instantaneously in the dominant direction.
- Trail Invalidation along Sub-Wave Lows: As Wave 3 advances, trail your structural invalidation level upward beneath the termination points of internal sub-waves (ii) and (iv). If internal sub-wave (iv) overlaps internal sub-wave (i), re-evaluate the count immediately.
- Watch for Momentum Divergence on Sub-Wave 5 of 3: Wave 3 does not conclude until its internal sub-wave (v) completes. Look for momentum divergence between sub-wave (iii) and sub-wave (v) of Wave 3 to mark the transition into Wave 4.
Wave 3 is the master builder of trends. By understanding its mathematical extension ratios, honoring its cardinal length rule, and respecting the raw velocity of Wave 3 of 3, you transform market momentum from a source of chaos into a quantifiable science.


Leave a Reply