Identifying the inception of a structural trend is the most challenging task in market geometry. When I analyze a chart at the conclusion of a prolonged corrective phase, sentiment is universally pessimistic, structural momentum appears dead, and retail participants anticipate unending continuation in the prevailing direction. Yet beneath this psychological exhaustion, the mathematical engine of a new five-wave motive sequence is born. I classify this foundational development as Wave 1. Recognizing Wave 1 in real time requires looking past narrative bias and focusing strictly on internal fractal subdivisions and structural breakout geometry.
The Anatomy of Structural Inception
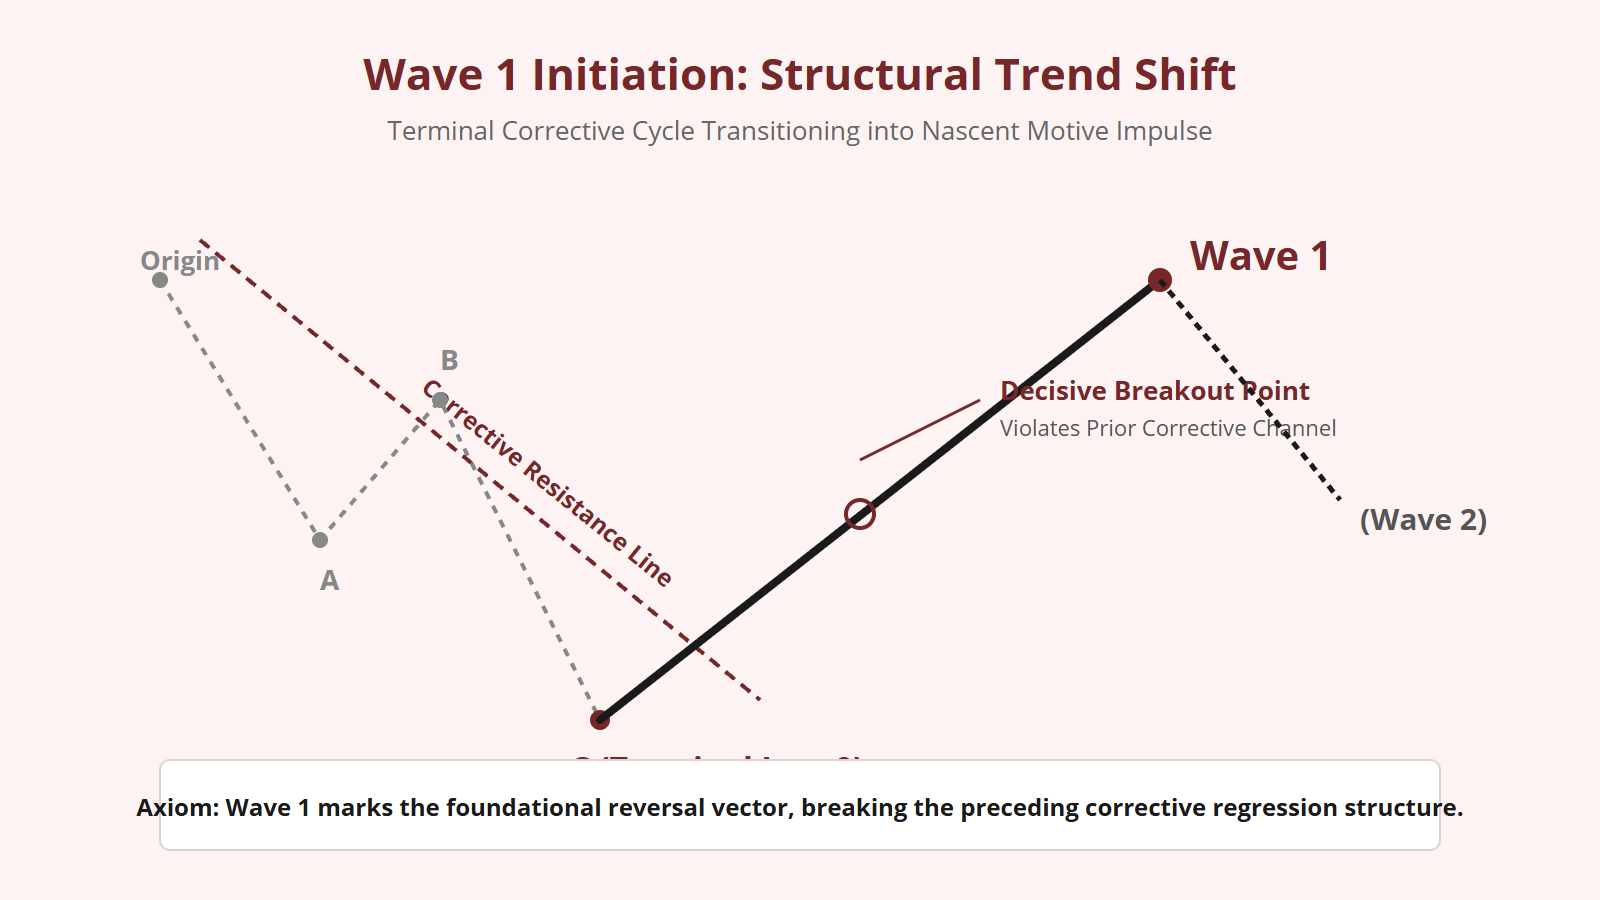
Wave 1 represents the initial kinetic shift where mass psychology pivots from corrective equilibrium to directional accumulation. Because it emerges directly from the terminal low of an antecedent multi-wave correction (most commonly a Wave (C) of an expanded flat, a zigzag, or a Wave (E) of a contracting triangle), the broader market remains completely unaware that the trend has reversed.
When I map Wave 1 across price space, I observe that it rarely unfolds as a violent, parabolic surge. Instead, it is characterized by steady, persistent accumulation. The majority of participants dismiss this initial advance as merely a temporary counter-trend bounce, assuming that the preceding dominant trend will promptly resume. This collective disbelief provides the geometric tension that fuels subsequent motive waves.
Mathematically, Wave 1 establishes the baseline spatial measurement for the entire subsequent motive cycle. Every projection I calculate—from the anticipated retracement depth of Wave 2 to the Fibonacci extension targets of Wave 3 and Wave 5—is derived directly from the vertical coordinate distance traversed by Wave 1.
Structural Breakout and Channel Invalidation
To mathematically confirm that a price advance is a genuine Wave 1 and not merely an internal corrective swing (such as Wave B of an ongoing consolidation), I evaluate two non-negotiable structural criteria:
- Decisive Breach of the Corrective Channel: I construct a regression channel encompassing the preceding corrective structure (connecting the origin of Wave A to the peak of Wave B, and projecting a parallel line through the trough of Wave A). Wave 1 must decisively break through the upper boundary of this corrective channel with increasing structural momentum.
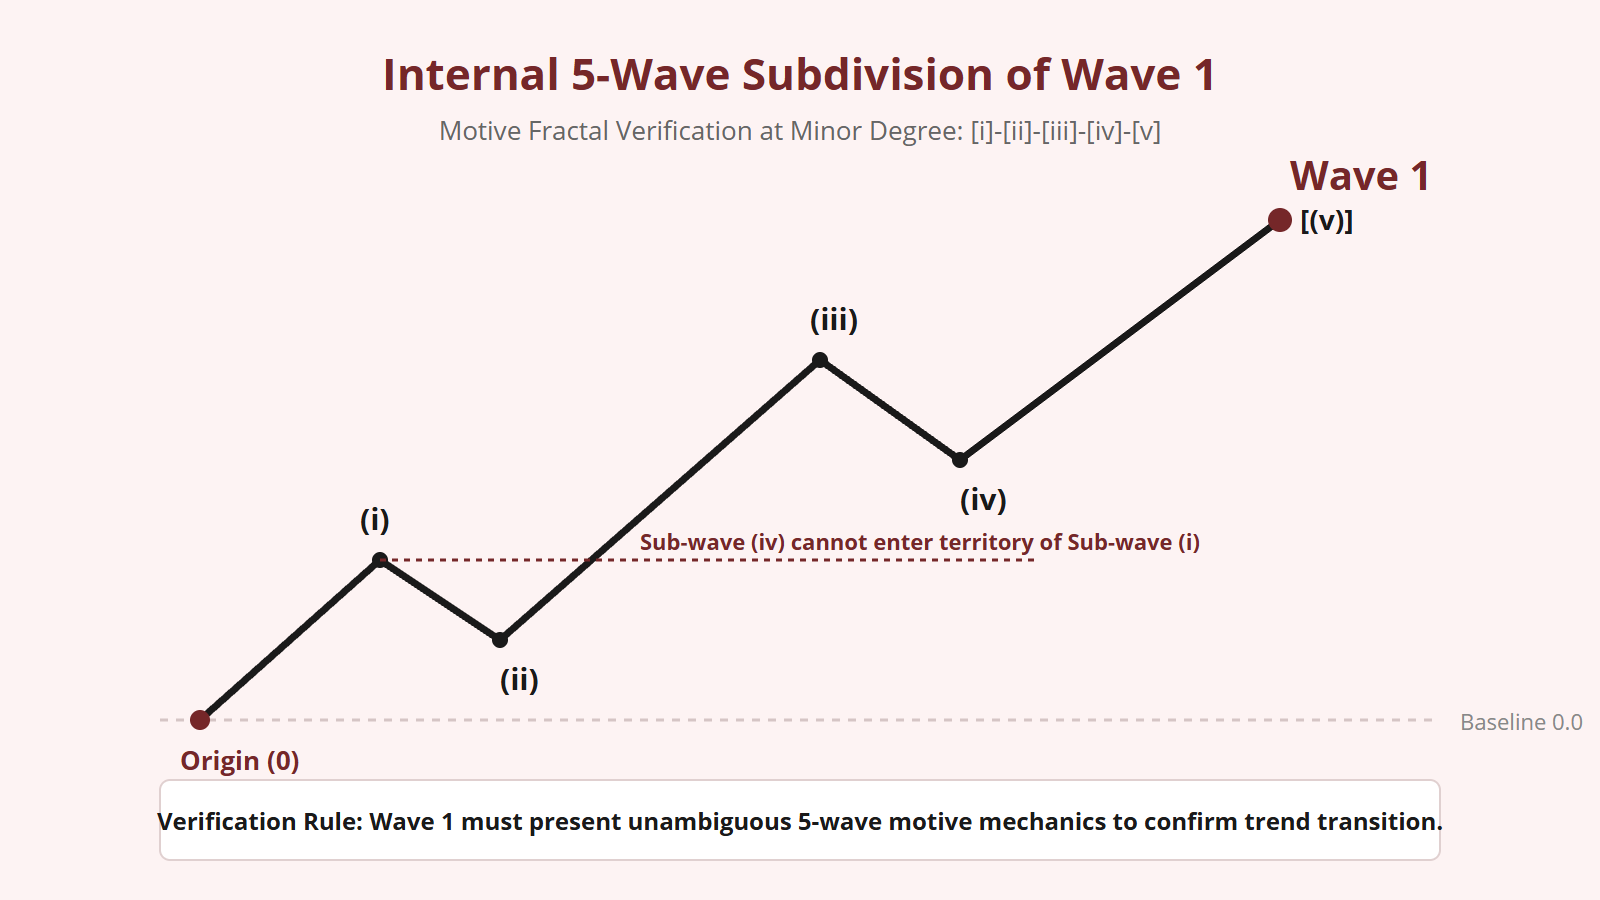
- Structural Subdivision into Five Waves: Corrective counter-trend bounces are strictly three-wave structures (A-B-C). In contrast, Wave 1 must unambiguously subdivide into a five-wave motive sequence. If the advance cannot be divided into five clear micro-legs, I immediately reject the Wave 1 count.
When price punches through the corrective resistance line and establishes a clean five-wave internal sequence, the probability of structural trend transition increases exponentially.
Internal Micro-Subdivisions: Verifying Fractal Integrity
Because the market is an entirely scale-invariant fractal, the internal structure of Wave 1 must mirror the governing axioms of the Elliott Wave Principle at the Minor and Minute degrees. When I zoom into the micro-structure of an emerging Wave 1, I systematically verify the following sequence: [i]-[ii]-[iii]-[iv]-[v].
Within this internal sequence, every cardinal law must be satisfied without exception:
- Sub-wave [ii] cannot retrace more than 100% of the origin of sub-wave [i].
- Sub-wave [iii] cannot be the shortest motive wave among [i], [iii], and [v]; in fact, sub-wave [iii] frequently exhibits the highest internal velocity of the micro-sequence.
- Sub-wave [iv] cannot overlap into the price territory of sub-wave [i] (unless Wave 1 is developing as a Leading Diagonal).
When an advance satisfies all three cardinal axioms on the micro degree, I know with mathematical certainty that I am observing an impulsive motive structure rather than a corrective consolidation.
Leading Diagonals: The Motive Wave 1 Variant
While the vast majority of first waves unfold as standard impulse waves, Wave 1 possesses a rare and fascinating structural variant: the Leading Diagonal. When a trend shift meets heavy residual resistance from the prior regime, the market struggles to achieve clean separation between sub-waves.
In a Leading Diagonal, the internal structure can take the form of 5-3-5-3-5 or 3-3-3-3-3, bound within converging boundary trendlines that form a wedge. Crucially, in a leading diagonal, sub-wave 4 is permitted to overlap into the price territory of sub-wave 1. When I identify a leading diagonal in the Wave 1 position, it signals that the market is expending immense structural effort to turn the tide against heavy resistance, warning me to expect an exceptionally deep Wave 2 retracement to follow.
Methodology: Confirming the Wave 1 Termination Point
Once Wave 1 completes its five internal subdivisions, directional momentum decelerates. To identify the exact termination coordinate of Wave 1, I monitor two mathematical indicators:
- Internal Fibonacci Ratio Confluence: Within the five sub-waves, sub-wave [v] will frequently achieve equality with sub-wave [i] ($v = i$), or reach the 0.618 extension of the net distance traversed by sub-waves [i] through [iii].
- Structural Momentum Divergence: I observe momentum oscillators on the micro timeframe. When sub-wave [v] forms a higher price extreme while the oscillator registers a lower high compared to sub-wave [iii], structural exhaustion is confirmed.
Recognizing the terminal peak of Wave 1 provides the ultimate analytical advantage: it allows me to anticipate the imminent Wave 2 retracement, calculate prospective Fibonacci golden pocket support levels, and prepare for the explosive expansion of Wave 3 with complete geometric clarity.


Leave a Reply