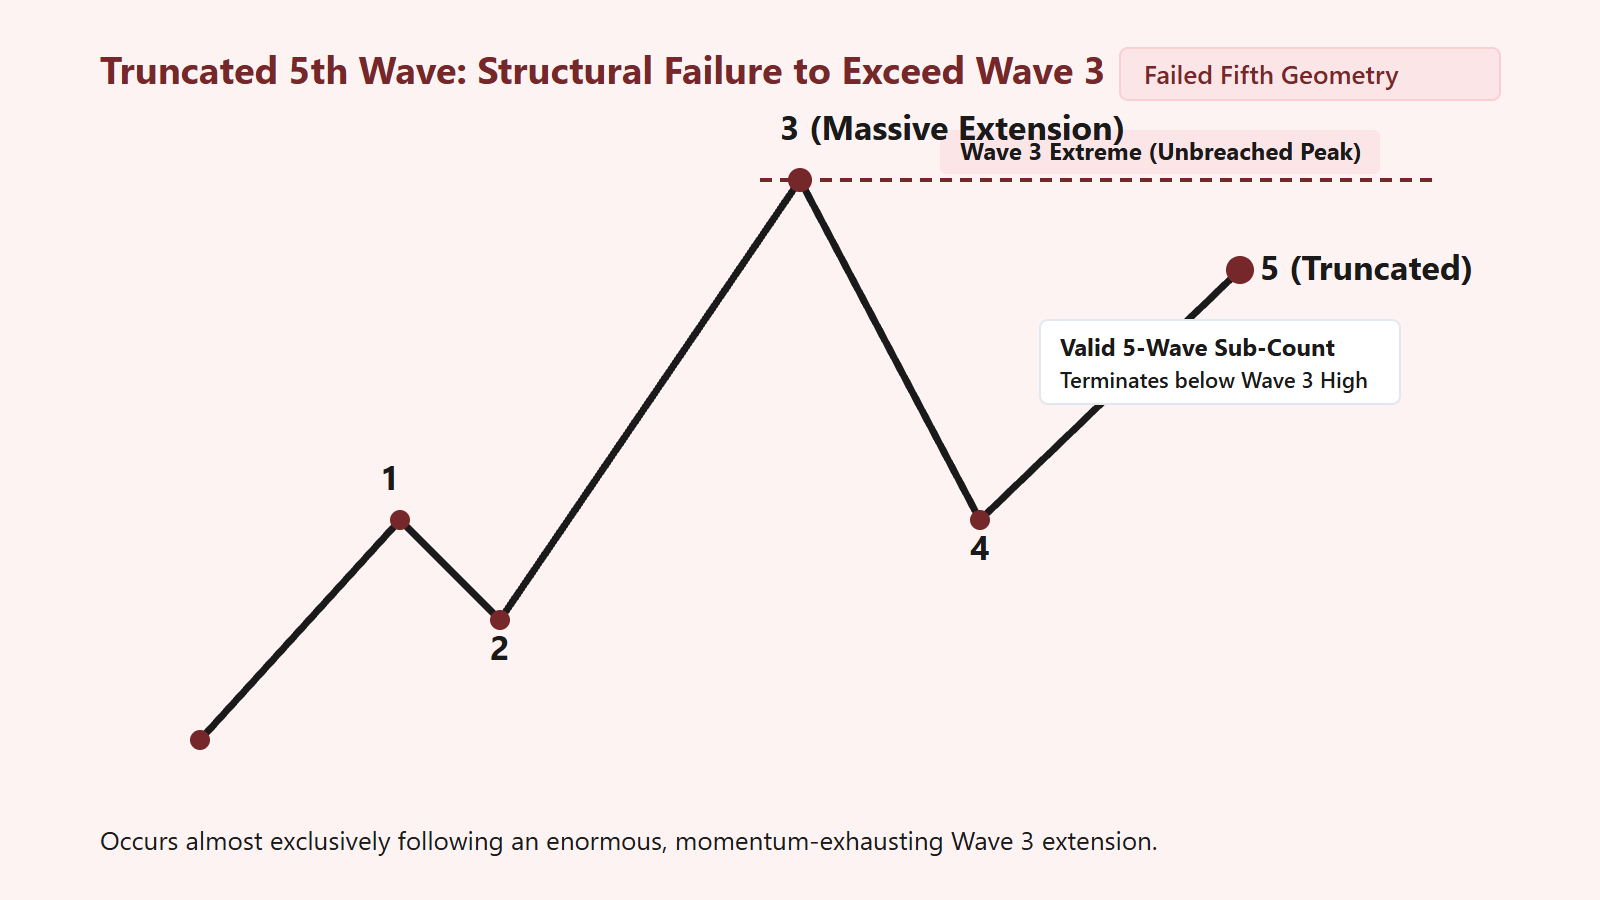
Market geometry is precise, but extreme psychological exhaustion can occasionally short-circuit a standard structure. While I generally expect a five-wave motive sequence to push steadily into new price territory, I must always be prepared for a structural anomaly known as a Truncation, or a “failed fifth wave.” A truncation occurs when Wave 5 contains the necessary internal five-wave subdivisions, but mathematically fails to exceed the extreme peak established by Wave 3. When I map this, I treat it as a massive geometric warning sign.
The Mechanics of Structural Truncation
Under standard wave rules, an impulse structure is defined by directional progress: Wave 3 must exceed the peak of Wave 1, and Wave 5 is expected to exceed the peak of Wave 3. This normal progression reflects an expanding or healthy trend where underlying market conviction remains intact until the final terminal push.
However, R.N. Elliott recognized that in specific conditions, the market’s underlying energy is completely consumed before Wave 5 can reach new price highs. When this happens, Wave 5 unfolds, subdivides into the obligatory five internal sub-waves, but exhausts itself below the crest of Wave 3. This phenomenon is termed Truncation.
It is vital to understand that a truncation is not an incomplete wave. It is not a missing wave, nor is it an analytical error where the wave count was cut short. A truncated Wave 5 is a complete, mathematically closed motive structure. It satisfies every internal requirement of wave mechanics—except the ability to establish a nominal higher high. When I identify a legitimate truncation, I know that the structural balance of power has undergone an abrupt, catastrophic realignment.
Why Truncations Occur: The Extended Wave 3 Hangover
Truncations do not occur randomly. In my analysis across decades of market charts, a truncation almost universally follows one specific geometric condition: an exceptionally violent, over-extended Wave 3.
When Wave 3 expands beyond standard Fibonacci metrics—surging to 2.618, 3.618, or 4.236 times the length of Wave 1—it generates an unsustainable psychological stampede. Market participants become completely over-leveraged, every available participant commits their capital, and momentum indicators reach generational extremes. The third wave essentially burns through all the fuel that was mathematically budgeted for the entire five-wave cycle.
When Wave 4 finally corrects, it often does so in a shallow, exhausted manner. When the market attempts to mount Wave 5, there are simply no remaining participants left to drive price into new territory. The sub-waves of Wave 5 struggle upward in a labored, overlapping, or weak fashion, and terminate prematurely. The resulting structure looks like a classical “double top” on a retail chart, but to an Elliottician, it is a textbook truncated fifth wave.
Rigorous Verification: Validating the Internal Sub-Waves
The term “truncation” is frequently abused by novice analysts as a convenient excuse when their wave counts fail. If a market reverses unexpectedly, an inexperienced chartist might immediately claim “it was a truncated Wave 5” to avoid admitting their primary count was incorrect. In my work, I never accept a truncation without rigorous mathematical proof.
To validate that a price failure is genuinely a truncated Wave 5, the structure must fulfill strict criteria:
- Five Internal Sub-Waves: Wave 5 must cleanly and unambiguously subdivide into five distinct sub-waves (labeled (i), (ii), (iii), (iv), and (v) of Minor or Minute degree). If the rally off the Wave 4 low only contains three sub-waves, it is not a truncation; it is merely an internal B-wave of a continued Wave 4 consolidation.
- Non-Violation of Cardinal Rules: Within the five sub-waves of the truncated Wave 5, sub-wave (iv) must not overlap sub-wave (i) (unless the structure is an ending diagonal), and sub-wave (iii) must not be the shortest wave among (i), (iii), and (v).
- Severe Momentum Divergence: Because Wave 5 is mathematically weak, technical indicators and structural momentum oscillators must show extreme bearish divergence between the peak of Wave 3 and the truncated crest of Wave 5.
If these three structural proofs are not present, I reject the truncation hypothesis and re-evaluate the degree of the prevailing corrective consolidation.
The Violent Reversal: Consequences of a Failed Fifth
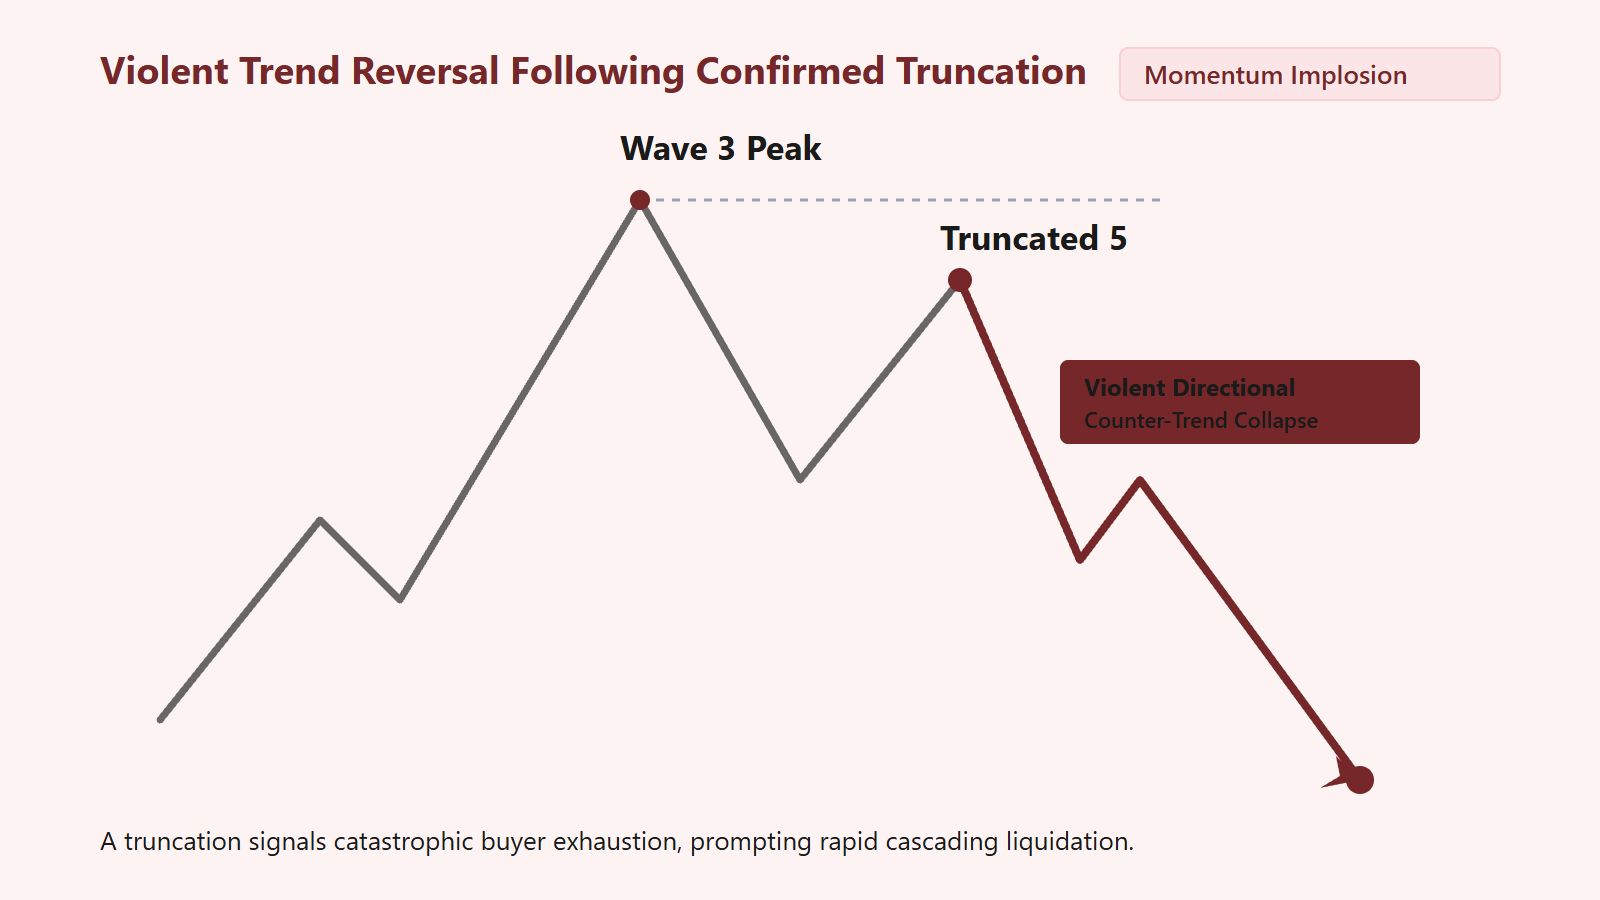
When a truncated Wave 5 terminates, the subsequent market reaction is not a gentle, leisurely correction. It is almost always an explosive, violent counter-trend liquidation.
The psychology behind this reaction is profound. During the formation of Wave 5, participants who bought the Wave 4 dip expect price to easily exceed the Wave 3 peak. As price stalls below that critical level and begins to break down, panic ensues. The market realizes that even after a full five-wave internal sequence, price could not conquer the prior high. All participants who bought into the terminal phase are instantly trapped.
This dynamic triggers what I call the Truncation Collapse Mechanism:
- The subsequent corrective wave (Wave A or Wave 1 of the new cycle) tears through the Wave 4 low with extraordinary velocity.
- Support levels that typically halt normal pullbacks fail to provide any meaningful stabilization.
- The market frequently retraces 100% of the entire preceding impulse in a fraction of the time it took to form the initial sequence.
Because the reversal is so severe, recognizing a truncation in real-time allows an analyst to avoid catastrophic losses and position for the powerful counter-trend cascade that inevitably follows.
Actionable Checklist for Navigating Truncated Environments
When tracking a market that has displayed a massive Wave 3 extension and is developing its fifth wave, use this disciplined checklist:
- Identify the Warning Sign: Did Wave 3 exceed the 2.618 extension of Wave 1? If yes, place truncation on your analytical radar as a distinct possibility.
- Monitor the Wave 3 High as Hard Resistance: Do not assume price will automatically punch through the Wave 3 apex. Treat the Wave 3 high as a critical geometric threshold.
- Drop Down to Micro-Degrees: As price approaches the Wave 3 peak, zoom into the 1-minute and 5-minute charts. Count the internal sub-waves of Wave 5. Are you currently in sub-wave (iv) or (v)?
- Confirm the Reversal Trigger: If sub-wave (v) terminates below the Wave 3 peak, wait for price to decisively break below the micro sub-wave (iv) low. A break of sub-wave (iv) provides the definitive confirmation that the truncated fifth wave is complete.
Truncations represent one of the purest expressions of psychological exhaustion in all of market geometry. They demonstrate that while mathematical rules are absolute, market energy is finite. When you learn to identify the subtle internal five-wave signatures of a failed fifth wave, you gain an immense edge in navigating the market’s most treacherous turning points.


Leave a Reply