In the vast majority of my structural analysis, I apply the three absolute axioms of impulse waves without hesitation. The most rigid of these axioms dictates that Wave 4 must never enter the price territory of Wave 1. However, market geometry is not entirely devoid of exceptions. When mass psychology reaches a state of extreme transition, the standard impulse structure breaks down into a highly specific, overlapping pattern.
I classify this unique formation as a Diagonal. A diagonal is a motive pattern, meaning it propels the market in the direction of the primary trend, but it exhibits the overlapping characteristics of a corrective wave. When I spot a diagonal forming on my charts, I immediately recognize it as a signal of geometric exhaustion or a sluggish structural initiation. I categorize them into two distinct types based entirely on where they appear in the macro cycle: Leading Diagonals and Ending Diagonals.
1. The Leading Diagonal (Structural Initiation)
I only look for Leading Diagonals at the very beginning of a new structural phase. They occur exclusively in the Wave 1 position of a fresh impulse sequence, or in the Wave A position of a Zigzag correction. It signals that a new trend is struggling to gain absolute momentum, resulting in deep, overlapping pullbacks.
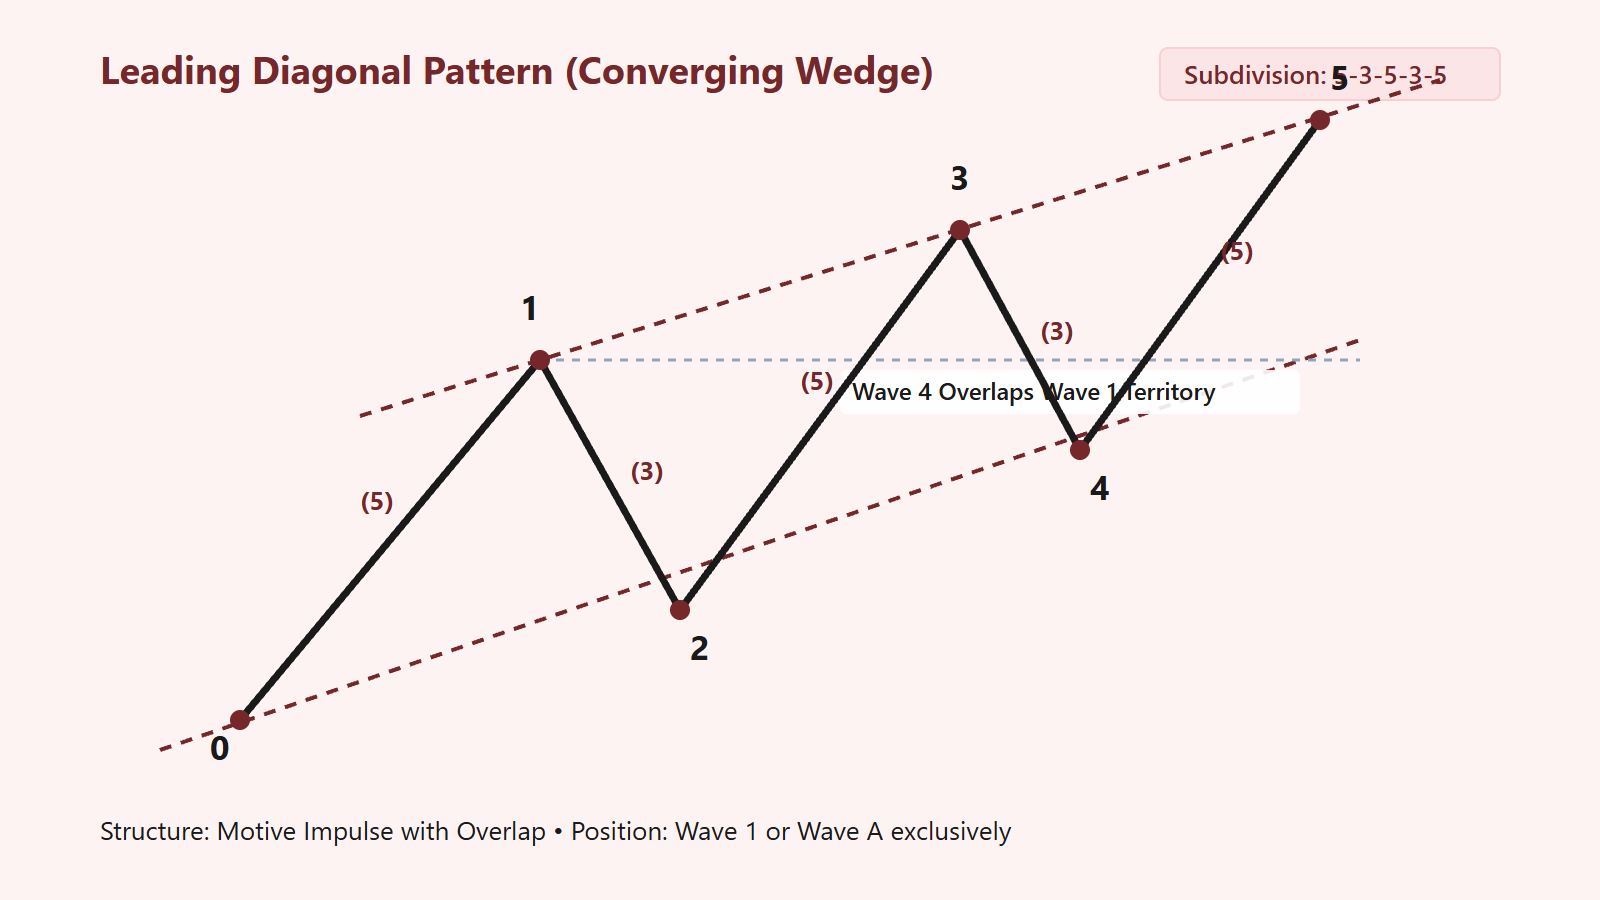
When I map a Leading Diagonal, I draw boundary trendlines connecting the peaks of Waves 1 and 3, and the troughs of Waves 2 and 4. In a standard leading diagonal, these boundary lines converge, forming a wedge shape. Crucially, the internal subdivision of a Leading Diagonal remains 5-3-5-3-5. This means Waves 1, 3, and 5 are standard motive waves, while Waves 2 and 4 are corrective.
Even though Wave 4 aggressively overlaps the price territory of Wave 1, the 5-3-5-3-5 internal geometry tells me that directional momentum is still present. It is simply fighting through heavy psychological resistance. Once the five-wave wedge completes, I anticipate a deep Wave 2 retracement before the true, non-overlapping impulse (Wave 3) ignites.
2. The Ending Diagonal (Terminal Exhaustion)
While the Leading Diagonal signals initiation, the Ending Diagonal is the ultimate geometric signature of terminal exhaustion. I only ever look for this pattern at the absolute end of a macro sequence—specifically in the Wave 5 position of an impulse, or the Wave C position of a correction.
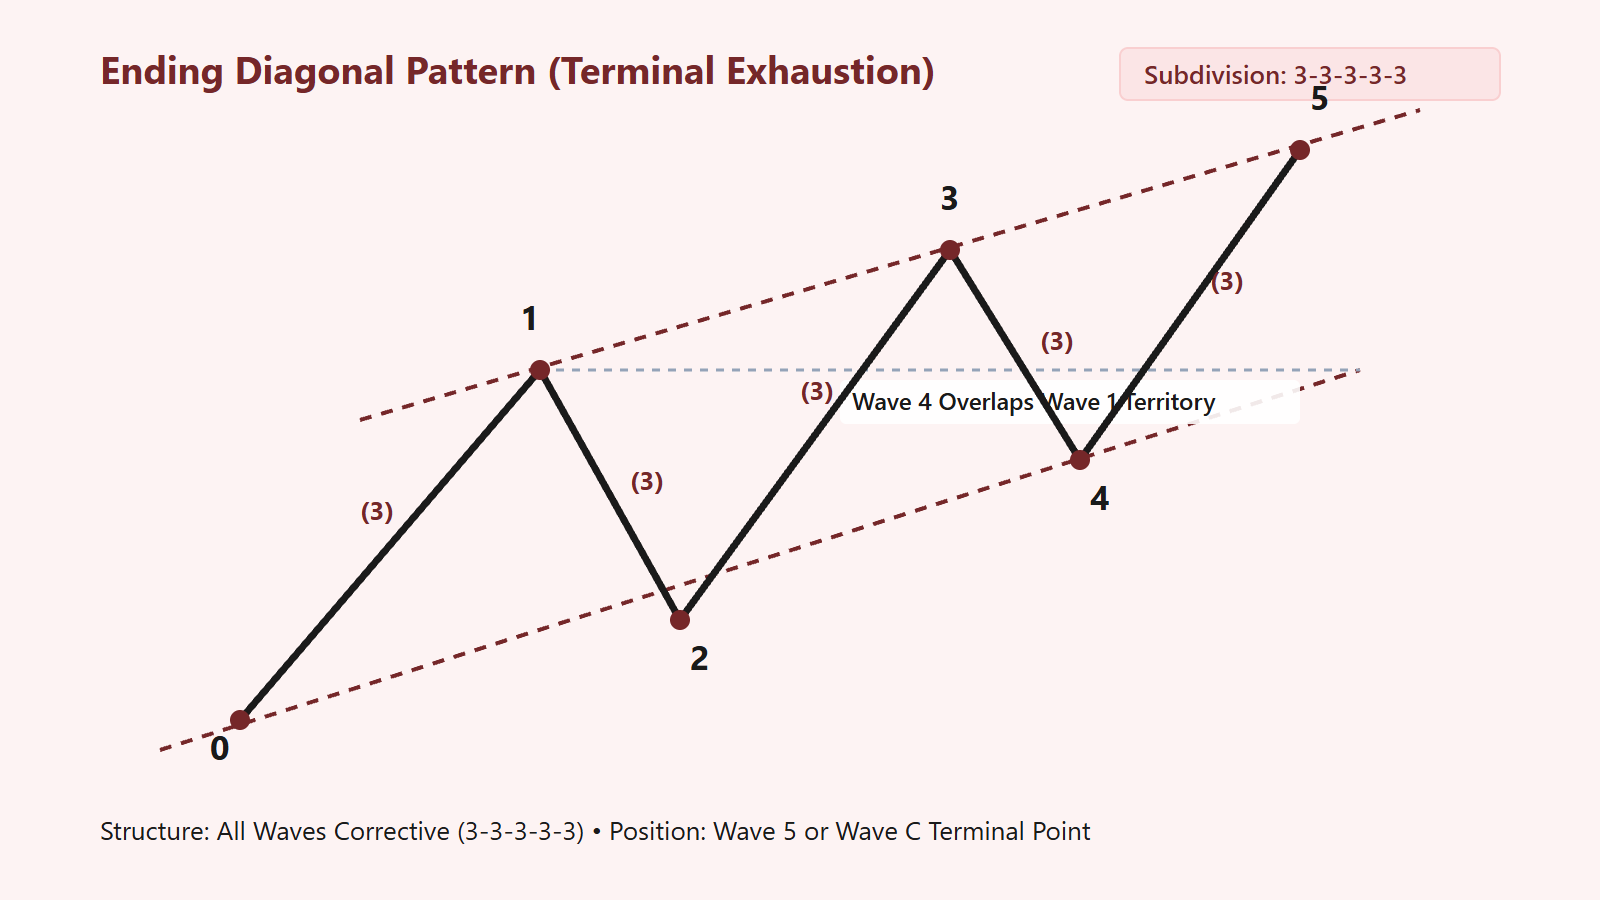
When an Ending Diagonal unfolds, the market is running on fumes. Participants are desperately trying to push the trend higher, but underlying momentum is evaporating. The resulting geometry is a converging wedge where Wave 4 overlaps Wave 1. But the internal structure is what reveals the truth: an Ending Diagonal subdivides as 3-3-3-3-3.
Every single leg of this pattern—even the directional Waves 1, 3, and 5—forms a three-wave corrective structure. When I count a 3-3-3-3-3 sequence pushing marginally into new territory, I know the market lacks the motive force to sustain the trend. The geometry is screaming that a violent reversal is mathematically imminent.
3. Contracting vs. Expanding Geometry
The vast majority of diagonals I encounter are Contracting Diagonals, where the upper and lower boundary trendlines converge toward a distant focal point. However, I must always remain vigilant for a rare geometric variant: the Expanding Diagonal.
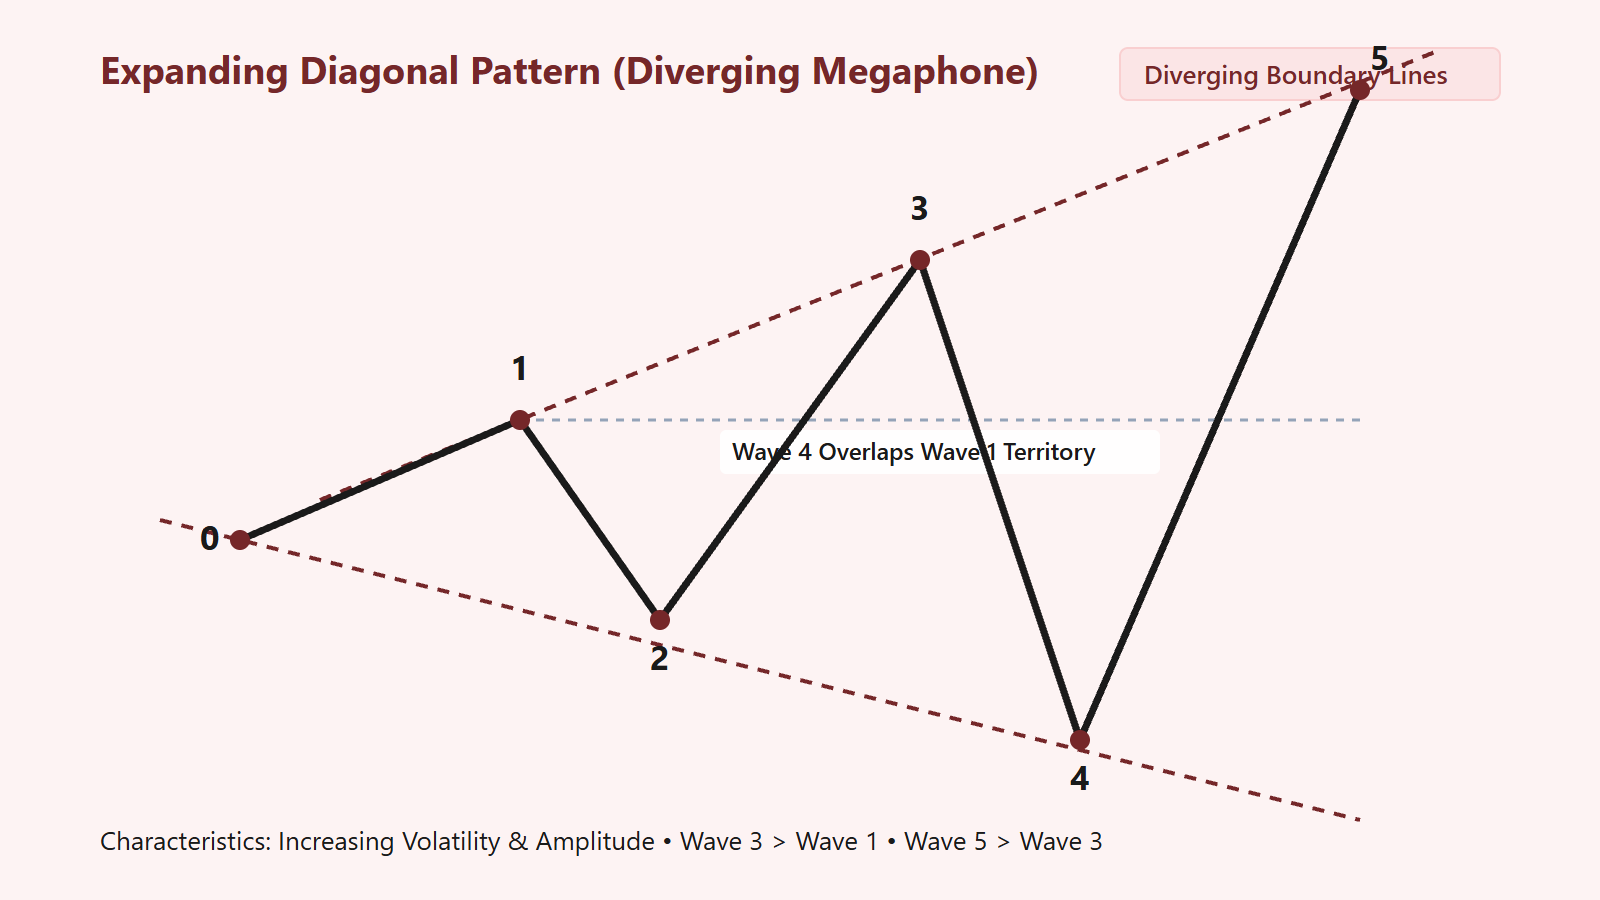
In an Expanding Diagonal, the market experiences wild, erratic swings. As the pattern progresses, the boundary trendlines diverge, creating a megaphone shape. Wave 3 is longer than Wave 1, Wave 4 is deeper than Wave 2, and Wave 5 is the longest of all. Despite this widening volatility, the core rule remains intact: Wave 4 overlaps Wave 1. Expanding diagonals are extremely difficult to trade in real-time, but their structural implications are identical to their contracting counterparts.
4. The Post-Diagonal Thrust: A Violent Resolution
I do not map diagonals simply to label a chart; I map them because they provide one of the most reliable geometric targeting mechanisms in structural analysis. The resolution of a diagonal—particularly an Ending Diagonal—is almost always dramatic.
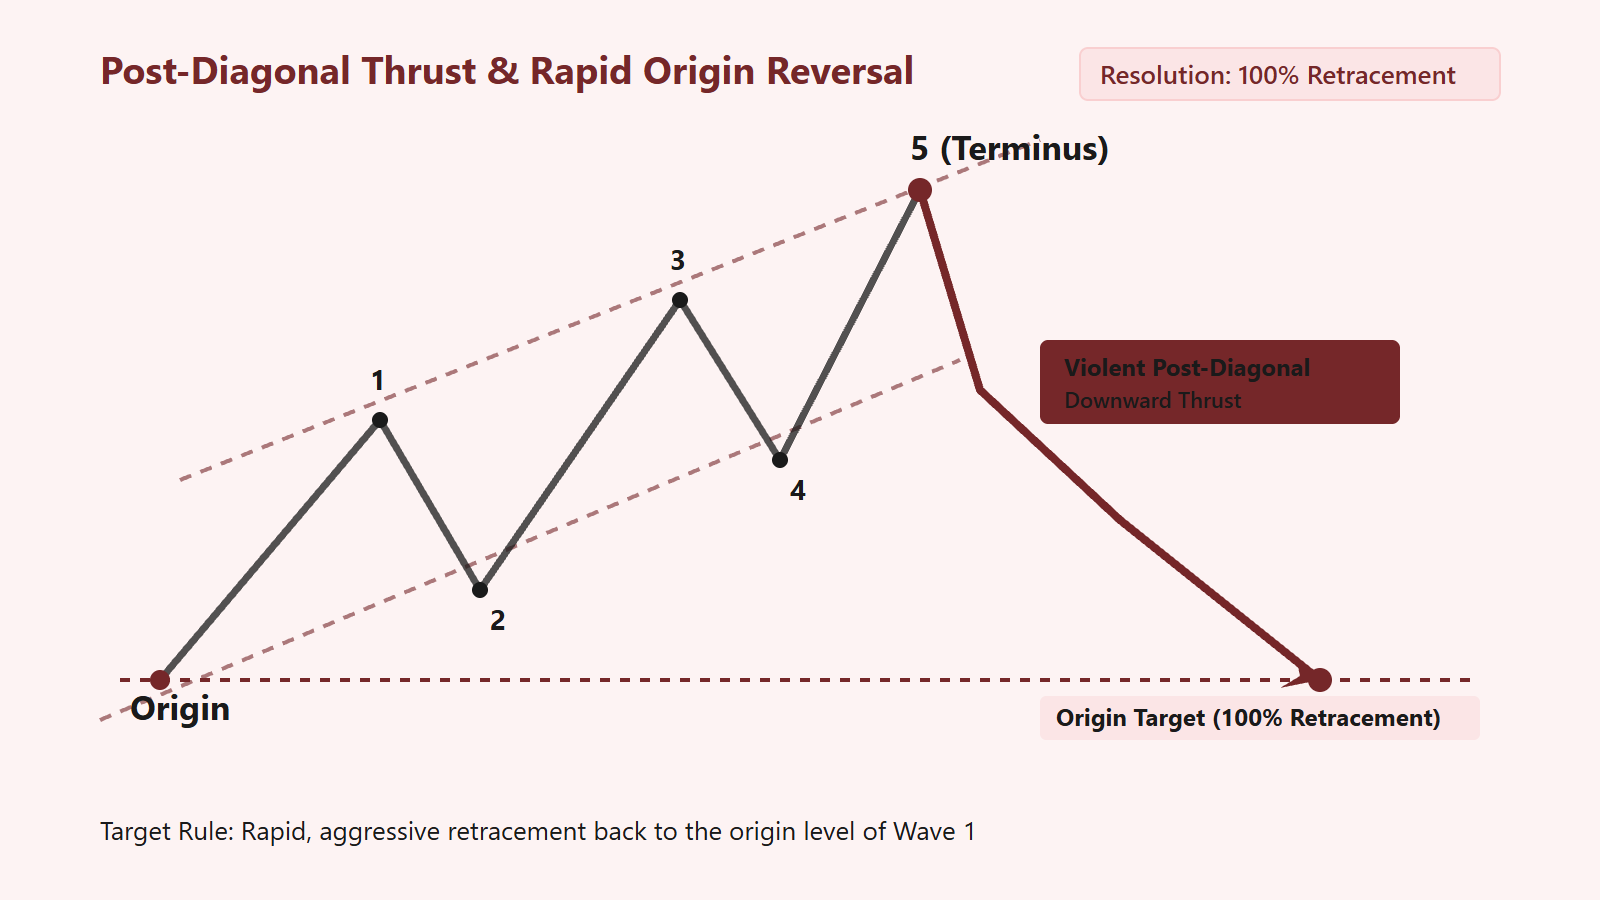
When the fifth and final wave of an Ending Diagonal terminates, the market routinely experiences a sharp, aggressive thrust in the opposite direction. My absolute geometric target for this reversal is the origin point of the diagonal itself (the start of Wave 1).
Because the diagonal represents a prolonged period of artificial momentum and exhaustion, the market snaps back to equilibrium rapidly once the boundary trendline is broken. By understanding this geometry, I am never caught off guard when a slow, grinding trend suddenly collapses into a violent retracement. The structure dictates the outcome.


Leave a Reply