When I map the structural geometry of any market, I find that impulse waves are generally straightforward to identify. They are aggressive, directional, and adhere to rigid mathematical axioms. However, when the market enters a consolidation phase, the geometry becomes significantly more complex. Identifying and navigating corrective wave structures is where I spend the vast majority of my analytical effort.
A corrective wave is a counter-trend movement that retraces a portion of the preceding motive wave. While motive waves always subdivide into a five-wave structure, corrective waves typically subdivide into three waves, or complex combinations of three-wave structures. When I encounter a pullback, I immediately begin classifying it into one of three primary geometric families: Zigzags, Flats, or Triangles.
1. The Zigzag Correction (5-3-5)
The Zigzag is the sharpest and most directional of the corrective structures. When I see a deep retracement that rapidly cuts into the preceding trend, I immediately look for a Zigzag formation. It consists of three waves labeled A, B, and C.
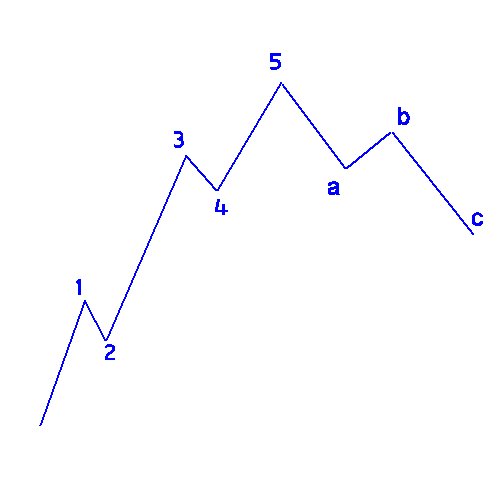
The internal mathematical subdivision of a Zigzag is 5-3-5. This means Wave A subdivides into five smaller motive waves, Wave B subdivides into three corrective waves, and Wave C subdivides into another five motive waves. Because Waves A and C are motive, the Zigzag covers a significant amount of price territory.
When I project Fibonacci targets for a Zigzag, I look for Wave C to equal 100% (a 1:1 ratio) of the geometric distance traveled by Wave A. If the market is particularly volatile, Wave C may extend to a 1.618 projection of Wave A, but the 1:1 ratio remains my baseline structural expectation.
2. The Flat Correction (3-3-5)
Unlike the sharp retracement of a Zigzag, a Flat correction moves sideways in a broader consolidation range. When I see a market that refuses to give up much price territory but requires time to digest a previous move, I map it as a Flat. The structural subdivision for a Flat is 3-3-5.
In this geometry, Wave A lacks the directional power to form a five-wave sequence; it only forms three waves. Wave B also forms three waves and often retraces nearly 100% of Wave A, returning to the origin point of the correction. Finally, Wave C forms a five-wave motive sequence that ends slightly beyond the termination point of Wave A.
I classify Flats into three sub-categories based on their specific geometry:
- Regular Flat: Wave B terminates near the start of Wave A, and Wave C terminates slightly past the end of Wave A.
- Expanded Flat: Wave B travels beyond the starting point of Wave A (showing exhaustion in the direction of the prior trend), and Wave C travels significantly beyond the end of Wave A.
- Running Flat: Wave B travels beyond the start of Wave A, but Wave C fails to reach the end of Wave A, indicating extreme underlying momentum in the primary trend.
3. The Triangle Correction (3-3-3-3-3)
Triangles represent a balance of forces between buyers and sellers, resulting in a tightening geometric coil. I only ever look for Triangles in the penultimate position of a larger structural degree—most commonly in Wave 4 of an impulse sequence, or Wave B of an A-B-C correction.
A Triangle consists of five overlapping waves labeled A, B, C, D, and E. Every single internal wave subdivides into a three-wave corrective structure (3-3-3-3-3). When I draw boundary trendlines connecting the termination points of A-C and B-D, I can immediately identify the type of triangle.
I categorize Triangles into Contracting (the most common, where boundary lines converge), Expanding (where boundary lines diverge), and Barrier (where one boundary is strictly horizontal while the other converges). The moment Wave E terminates within the boundary lines, I anticipate a sharp, aggressive thrust in the direction of the primary trend.
4. Complex Combinations (W-X-Y and W-X-Y-X-Z)
Occasionally, the market requires a prolonged period of structural consolidation that a single Zigzag or Flat cannot satisfy. In these environments, I observe the market linking standard corrective patterns together into complex combinations.
I label these structures as Double Threes (W-X-Y) or Triple Threes (W-X-Y-X-Z). Wave W represents the first standard correction (e.g., a Zigzag). Wave X acts as a connective tissue—a smaller correction that links the structures. Wave Y represents the second standard correction (e.g., a Flat). This effectively drags the correction out across a longer time horizon without necessarily retracing deeper into the price structure.
Objectivity in Corrective Environments
Navigating corrective waves is an exercise in extreme patience. When I map these structures, I do not anticipate the resumption of the primary trend until I can mathematically validate the internal subdivisions of the final C, E, or Y wave. By relying entirely on the 5-3-5, 3-3-5, and 3-3-3-3-3 structural frameworks, I eliminate the noise of sideways consolidation and patiently wait for the geometry to resolve.


Leave a Reply