In strict mathematical taxonomy, the number 0.500 is not a pure Fibonacci ratio generated by dividing adjacent numbers in the sequence. Yet in the empirical geometry of market charts, 0.500 is one of the most powerful and heavily respected retracement levels in technical analysis. Ralph Nelson Elliott, W.D. Gann, and modern quantitative analysts all recognize the 50% coordinate as the universal point of structural equilibrium. In my analytical work, the 0.500 retracement serves as the critical dividing line between shallow momentum consolidations and deep liquidity retests. Decoding its harmonic behavior is essential for mapping structural balance.
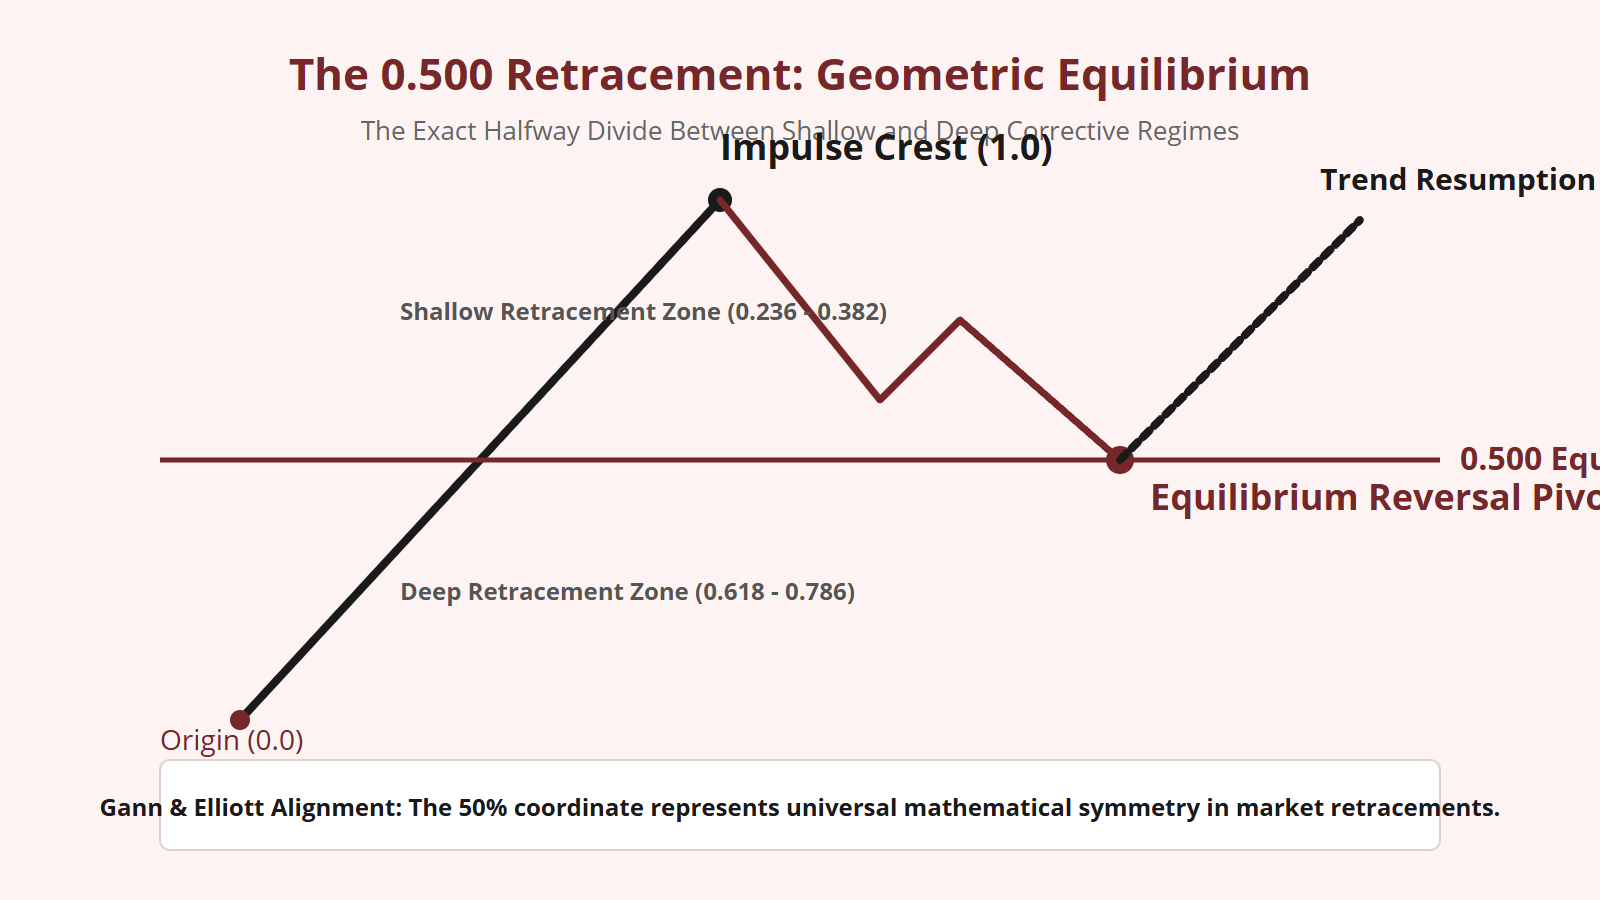
The Mathematical and Geometric Nature of 50%
While 0.500 does not emerge directly from the ratio of consecutive Fibonacci numbers (such as 0.618 or 0.382), it is intimately bound to the Fibonacci summation sequence through internal structural averages. As the sequence expands, the alternating ratios oscillate above and below the Golden Mean, with 0.500 functioning as the perfect arithmetic midpoint between zero and unity ($1.000$).
In physical and natural systems, 50% represents static balance: the exact center of gravity where opposing forces achieve temporary symmetry. In financial geometry, when a market advances 100 points, pulling back exactly 50 points wipes out half of the accumulated progress.
This 50% threshold represents the ultimate psychological battleground: buyers who entered early have surrendered half their paper gains, while sellers who shorted the top have achieved a 1:1 reward-to-risk ratio relative to the advance. If the market stabilizes and pivots at 0.500, it proves that underlying structural demand remains in control of the larger trend.
The 0.500 Level as the Structural Divide
In my analytical practice, I treat the 0.500 coordinate as a dynamic diagnostic filter that classifies the character of an active correction:
- Above 0.500 (Shallow Momentum Regime): If a correction terminates and reverses before reaching the 50% line (holding at 0.236 or 0.382), the market is operating in a high-momentum regime. This is typical for Wave 4 consolidations and running corrections, forecasting that the subsequent motive wave will be aggressive.
- At 0.500 (Harmonic Equilibrium): A precise pivot at 0.500 reflects perfect mathematical symmetry. It frequently appears in balanced Wave 2 pullbacks, Wave B of regular flats, and intermediate swings within complex corrective combinations.
- Below 0.500 (Deep Liquidity Regime): If a correction slices cleanly through the 50% coordinate, the shallow-correction hypothesis is eliminated. The market enters the deep retracement zone, virtually guaranteeing that price will test the 0.618 golden pocket or the 0.786 deep retest level before finding structural stabilization.
Observing how price behaves as it approaches the 0.500 coordinate provides immediate clarity on whether the correction will be swift and shallow or prolonged and deep.
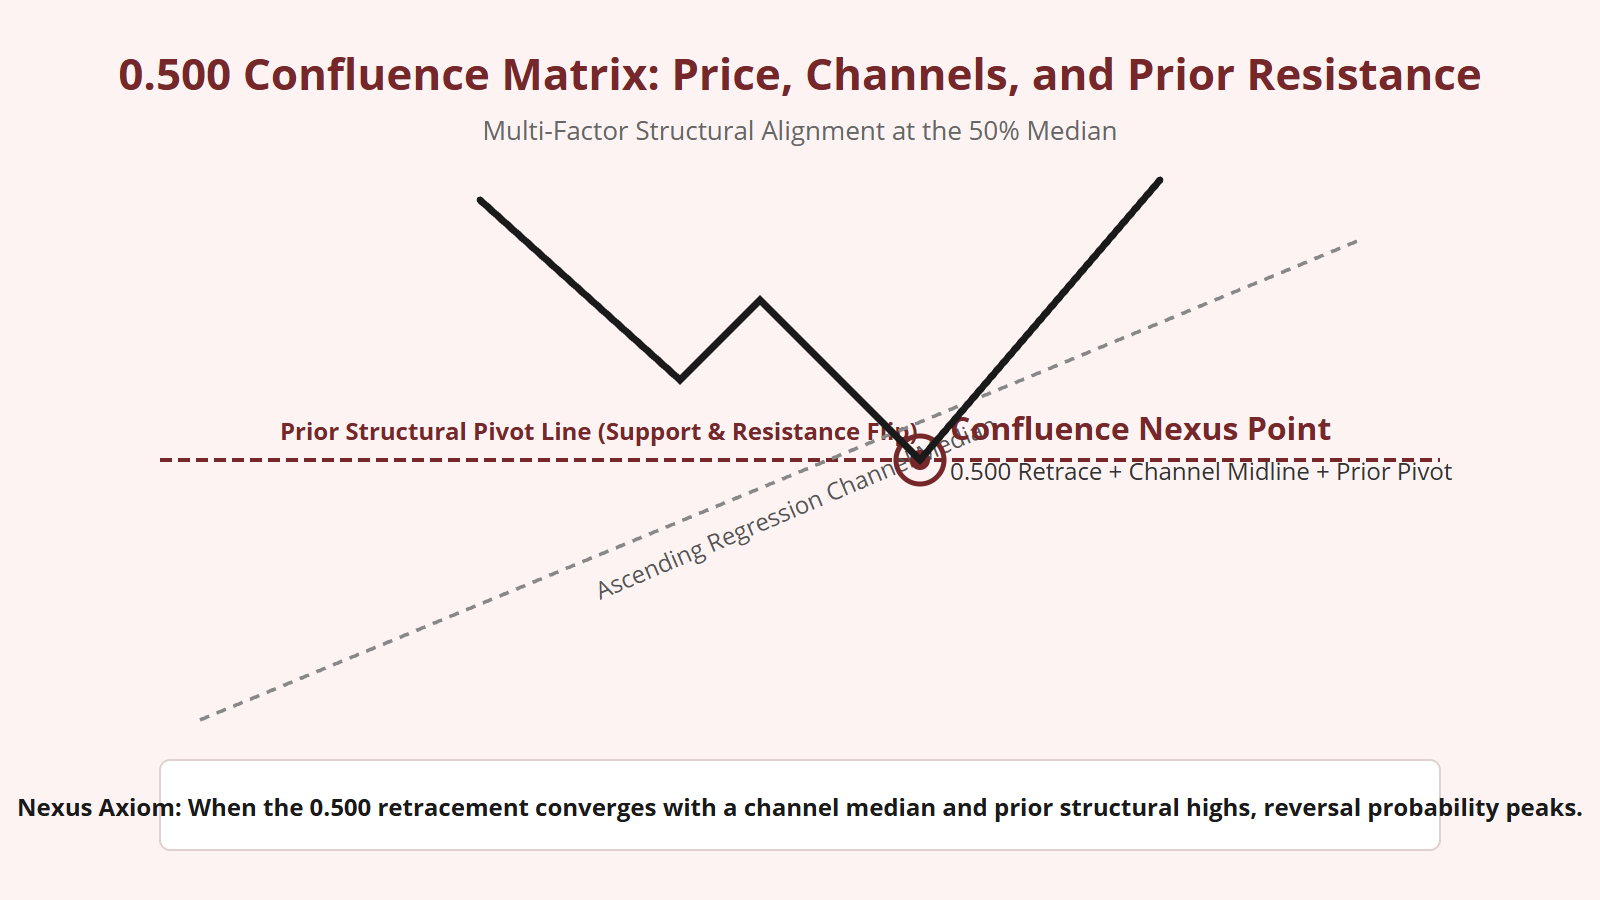
Confluence Matrix: Price, Channels, and Historical Pivots
An isolated 50% line on a chart is merely a mathematical coordinate; its true power is realized when it forms a Multi-Factor Confluence Matrix. When I analyze a potential 0.500 pivot, I look for structural alignment across three distinct geometric dimensions:
- Prior Structural Support and Resistance: The 0.500 retracement of a current swing frequently aligns with the extreme peak of an antecedent sub-wave (such as Wave 1 peak or a major breakout level). When an old resistance ceiling flips into new support at the exact 50% mark, the structural floor is exceptionally solid.
- Regression Channel Midlines: When I draw a parallel trend channel encompassing the larger trend degree, the dashed midline (the 50% median of the channel) often intersects the vertical 0.500 price retracement at a single point in space and time.
- Corrective Wave Subdivisions: Within an internal A-B-C correction, the 100% equality target of Wave C ($C = A$) frequently lands directly on the 0.500 retracement of the parent motive wave.
When prior resistance, a channel median, and Wave C equality all converge at the 0.500 level, the probability of an immediate trend reversal approaches structural certainty.
Gann’s 50% Law and Elliott Wave Synthesis
W.D. Gann, one of the pioneers of geometric market analysis, placed immense emphasis on the 50% retracement, referring to it as the “Gravity Center” of any price range. Gann stated that when a market breaks below its 50% coordinate, it enters a state of structural weakness, whereas holding above 50% confirms dominant structural strength.
When we synthesize Gann’s gravity center with Elliott Wave mechanics, we uncover remarkable synergy. In an impulse sequence, Wave 2 can retrace 50% of Wave 1, and Wave 4 can retrace 50% of Wave 3 (if Wave 3 was extended). However, in both cases, the 50% level functions as an elastic trampoline: price touches the level, consolidates briefly, and springs violently back in the primary direction.
Methodology: Trading Around the Equilibrium Pivot
To incorporate the 0.500 level into your structural charting with mathematical rigor, follow this methodology:
- Measure Complete Impulses Only: Never measure retracements on unfinished wave structures. Verify that the preceding wave has completed all five sub-waves before anchoring your Fibonacci retracement tool.
- Watch Price Action at the Halfway Mark: As price enters the 0.480 to 0.520 band, monitor lower timeframe volume and candlestick range. Look for deceleration in selling velocity, long wicks, and micro-impulsive reaction bars.
- Set Precise Risk Parameters: If positioning at a 0.500 confluence pivot, place your structural invalidation level just beyond the 0.618 golden pocket. If price breaks cleanly past 0.618, the 50% equilibrium hypothesis has failed.
The 0.500 retracement is technical analysis’s great universal anchor. By respecting its role as the mathematical midpoint of market geometry, you bring balance, clarity, and discipline to your structural mapping.


Leave a Reply