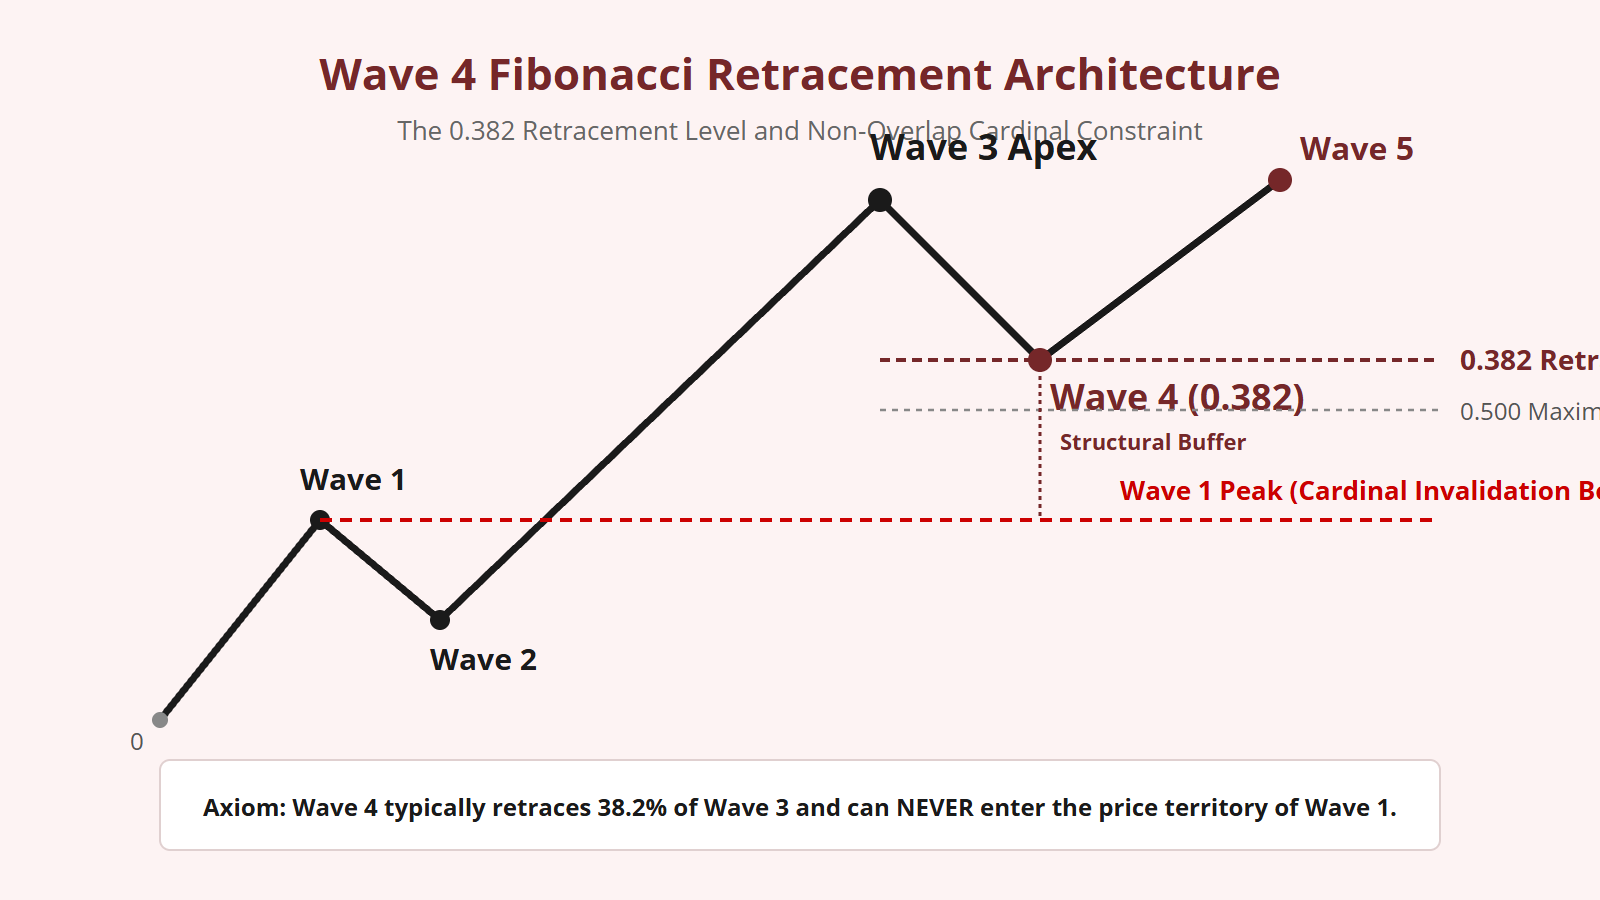
Within a standard five-wave motive sequence, each corrective wave possesses a distinct mathematical personality governed by Fibonacci ratios. While Wave 2 is famous for executing deep, aggressive pullbacks toward the 0.618 golden ratio, Wave 4 operates under an entirely different geometric regime. Wave 4 is shallow, complex, and persistent. Its primary mathematical benchmark is the 0.382 Fibonacci retracement of the preceding extended third wave. In my daily analysis, measuring the 0.382 ratio in Wave 4 is essential not only for identifying optimal consolidation support, but for ensuring that the non-negotiable non-overlap rule of Wave 1 remains unviolated.
The Mathematical Origin of the 0.382 Ratio
The 0.382 ratio is not an arbitrary metric; it is an intrinsic mathematical property of the Fibonacci summation sequence (1, 1, 2, 3, 5, 8, 13, 21, 34, 55, 89…). When you divide any Fibonacci number by the number two places ahead of it in the sequence, the quotient approaches 0.381966 (rounded to 0.382):
$$\lim_{n \to \infty} \frac{F_n}{F_{n+2}} = \frac{1}{\Phi^2} = \frac{1}{2.618} \approx 0.382$$
Furthermore, 0.382 is the direct mathematical inverse and complement of the primary Golden Ratio ($\Phi = 0.618$), because:
$$1.000 – 0.618 = 0.382$$
In market mechanics, this inverse relationship reflects the Guideline of Alternation. Because Wave 2 consumed a deep 0.618 fraction of Wave 1, Wave 4 balances the motive system by consuming only the complementary 0.382 fraction of Wave 3. This mathematical harmony gives the five-wave impulse sequence its aesthetic equilibrium.
Wave 4 Mechanics: Why 0.382 is the Primary Target
Why does Wave 4 consistently halt near the 38.2% retracement level rather than plunging into a deeper 61.8% pullback? The answer lies in the kinetic momentum established during Wave 3.
Wave 3 is the powerful centerpiece of the trend, characterized by immense volume, institutional conviction, and wide-range price expansion. By the time Wave 3 terminates, the market’s directional bias is overwhelming. While some participants take profits—causing Wave 4 to unfold—the vast majority of market participants are eager to enter the trend on the first available pullback.
This aggressive underlying bid creates a high floor beneath price. Sellers simply cannot force price into a deep discount. The consolidation stalls as soon as it reaches the shallow 0.382 Fibonacci coordinate of the third wave:
$$\text{Wave 4 Target} = \text{Wave 3 Apex} – (\text{Length of Wave 3} \times 0.382)$$
In over 65% of verified impulse sequences with an extended Wave 3, Wave 4 achieves its primary structural pivot within a narrow band surrounding this exact 38.2% level.
Confluence with Previous Sub-Wave 4 Territory
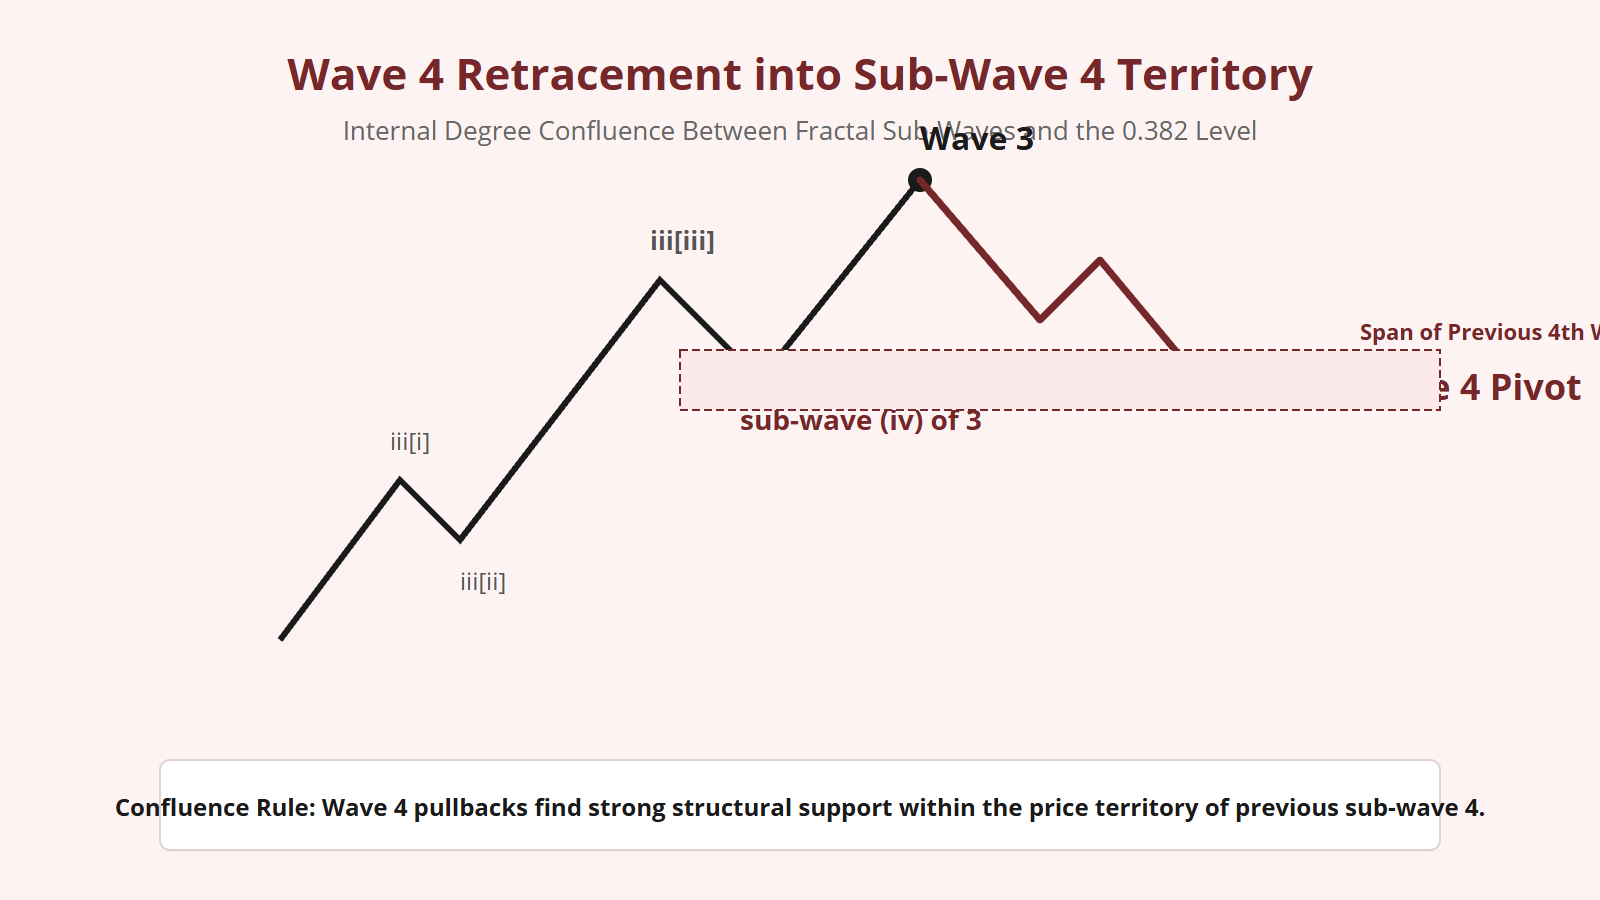
A fundamental structural guideline established by Ralph Nelson Elliott is that corrective waves tend to terminate within the price span of the previous fourth wave of one lesser degree.
When you examine an extended Wave 3, it subdivides internally into five sub-waves: [i]-[ii]-[iii]-[iv]-[v]. Sub-wave [iv] of that third wave formed a distinct consolidation range before sub-wave [v] surged to the third wave peak.
Remarkably, when you calculate the 0.382 Fibonacci retracement of the entire Wave 3, that exact price coordinate almost universally aligns with the horizontal price band established by sub-wave [iv] of 3!
This creates a powerful Fractal Confluence Zone: the mathematical ratio (0.382) intersects the historical structural support of the lesser degree fourth wave. When price enters this zone and completes a 3-wave corrective subdivision, structural exhaustion is confirmed.
The Inviolable Non-Overlap Rule (Cardinal Law 3)
While tracking a 0.382 retracement, an analyst must continuously monitor the absolute ceiling of Wave 1. The third Cardinal Law of Elliott Wave mechanics states:
In a standard, healthy motive wave, the 0.382 retracement coordinate sits comfortably above the peak of Wave 1, leaving a clean structural buffer zone between the two waves.
However, if Wave 3 was unusually short (or if Wave 1 was unusually long), a 38.2% retracement of Wave 3 might dip below the Wave 1 peak. If price breaches the Wave 1 peak by even a single tick, the standard impulse count is immediately destroyed. In such conditions, Wave 4 must either truncate at a shallower retracement (such as 23.6%) to preserve the rule, or the entire structure must be reclassified as a diagonal.
Operational Protocol: Navigating the Wave 4 Retracement
To accurately capitalize on the 0.382 Wave 4 setup, I follow this analytical protocol:
- Wait for Wave 3 Completion: Do not project Wave 4 retracements while Wave 3 is still subdividing. Confirm that sub-wave [v] of Wave 3 has finished with momentum divergence.
- Calculate Retracement Coordinates: Plot the 0.236, 0.382, and 0.500 retracements of Wave 3. Highlight the 0.382 level as the primary benchmark.
- Verify Wave 4 Corrective Architecture: Ensure that Wave 4 unfolds as a valid corrective family (a flat, triangle, or complex combination). Wave 4 rarely unfolds as a simple zigzag when Wave 2 was already a zigzag.
- Confirm the Reversal at 0.382: Look for internal sub-wave exhaustion within Wave 4 (such as the completion of sub-wave [c] of a flat or sub-wave [e] of a triangle) precisely at or near the 0.382 coordinate.
By treating the 0.382 ratio not as a magical number, but as the mathematical signature of momentum balance in Wave 4, you acquire the discipline to let complex consolidations mature before riding the final Wave 5 thrust.


Leave a Reply