If Wave 1 represents the initial spark of structural change, Wave 2 is the mathematical crucible where the new trend is tested. In my analytical work, Wave 2 is one of the most critical junctures on any chart. It is governed by a ruthless cardinal rule that separates valid impulse counts from complete structural failures. Mass psychology during Wave 2 is dominated by residual fear and cynicism, prompting a deep pullback that re-tests the structural foundation. Understanding the exact Fibonacci retracement ratios and the absolute invalidation boundary of Wave 2 is the hallmark of objective wave mapping.
The Psychological Driver of Wave 2 Pullbacks
To understand the geometry of Wave 2, one must understand the emotional state of market participants during its formation. When Wave 1 concludes, participants who remain mentally anchored to the prior macro trend view the pullback as confirmation that the previous trend has resumed. They aggressively add to their counter-directional positions, driving price down in a seemingly relentless decline.
However, beneath the surface, the character of the selling is fundamentally different from a true motive wave. The volume is typically lower, the internal subdivisions are strictly corrective, and the downward thrust lacks the sustained acceleration of an impulsive trend. Wave 2 does not represent the rebirth of the old trend; it represents the final clearing of weak hands before the structural system unleashes its primary expansion phase.
In my charting practice, I welcome deep Wave 2 pullbacks because they establish unambiguous mathematical reference coordinates for trend continuation.
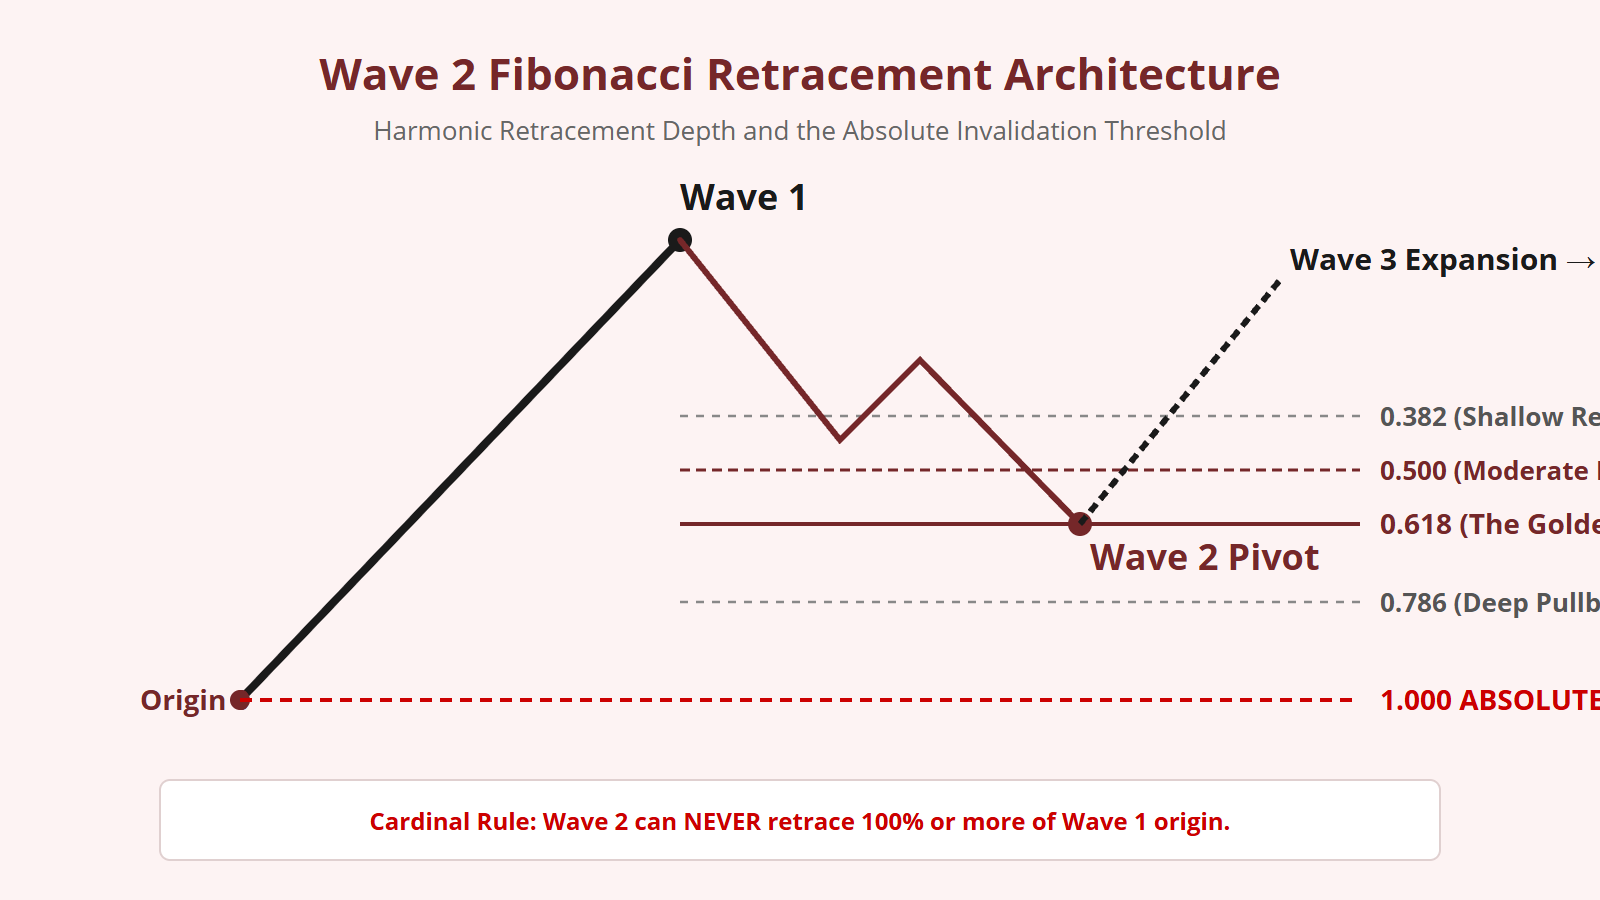
The Cardinal Law: Absolute Invalidation at 100%
The Elliott Wave Principle contains several flexible guidelines, but it also contains three unbreakable Cardinal Laws. The first and most definitive of these laws governs Wave 2:
This is not a subjective guideline; it is an absolute mathematical boundary. The origin of Wave 1 represents Coordinate 0.0. If a pullback reaches, touches, or exceeds Coordinate 0.0 by even a fraction of a pip or point, the entire impulse count is immediately and irrevocably invalidated.
When this invalidation occurs, I do not hope, rationalize, or force the wave count. The mathematical framework has definitively told me that the advance was not a genuine Wave 1, but rather an internal sub-wave (such as Wave B or Wave X) of a larger, ongoing corrective complex. This binary invalidation threshold is what gives Elliott Wave analysis its unmatched precision.
The Fibonacci Retracement Hierarchy of Wave 2
Because Wave 2 is a corrective reaction against a nascent trend, it tends to retrace a substantial portion of Wave 1. When I measure the Fibonacci retracement coordinates of Wave 1, I project four primary geometric pivot zones:
- 0.382 Retracement (Shallow): A 38.2% retracement is exceptionally rare for Wave 2. When Wave 2 terminates at 0.382, it indicates overwhelming underlying momentum, signaling that the forthcoming Wave 3 will likely be a historic super-extension.
- 0.500 Retracement (Equilibrium): A 50.0% pullback represents the mathematical midpoint of Wave 1, offering initial structural stabilization.
- 0.618 Retracement (The Golden Pocket): The 61.8% Fibonacci ratio is the classic, textbook termination coordinate for Wave 2. In over 60% of verified impulse structures, Wave 2 exhausts its momentum within the narrow band between 0.618 and 0.650.
- 0.786 to 0.886 Retracement (Deep Re-test): In highly volatile markets or following a Leading Diagonal Wave 1, Wave 2 frequently executes a deep liquidity re-test, pulling back 78.6% or even 88.6% of Wave 1. While psychologically terrifying to retail participants, a 78.6% retracement remains completely valid under wave mechanics as long as the 100% origin line remains unbreached.
Corrective Subdivision: Zigzags vs. Flats
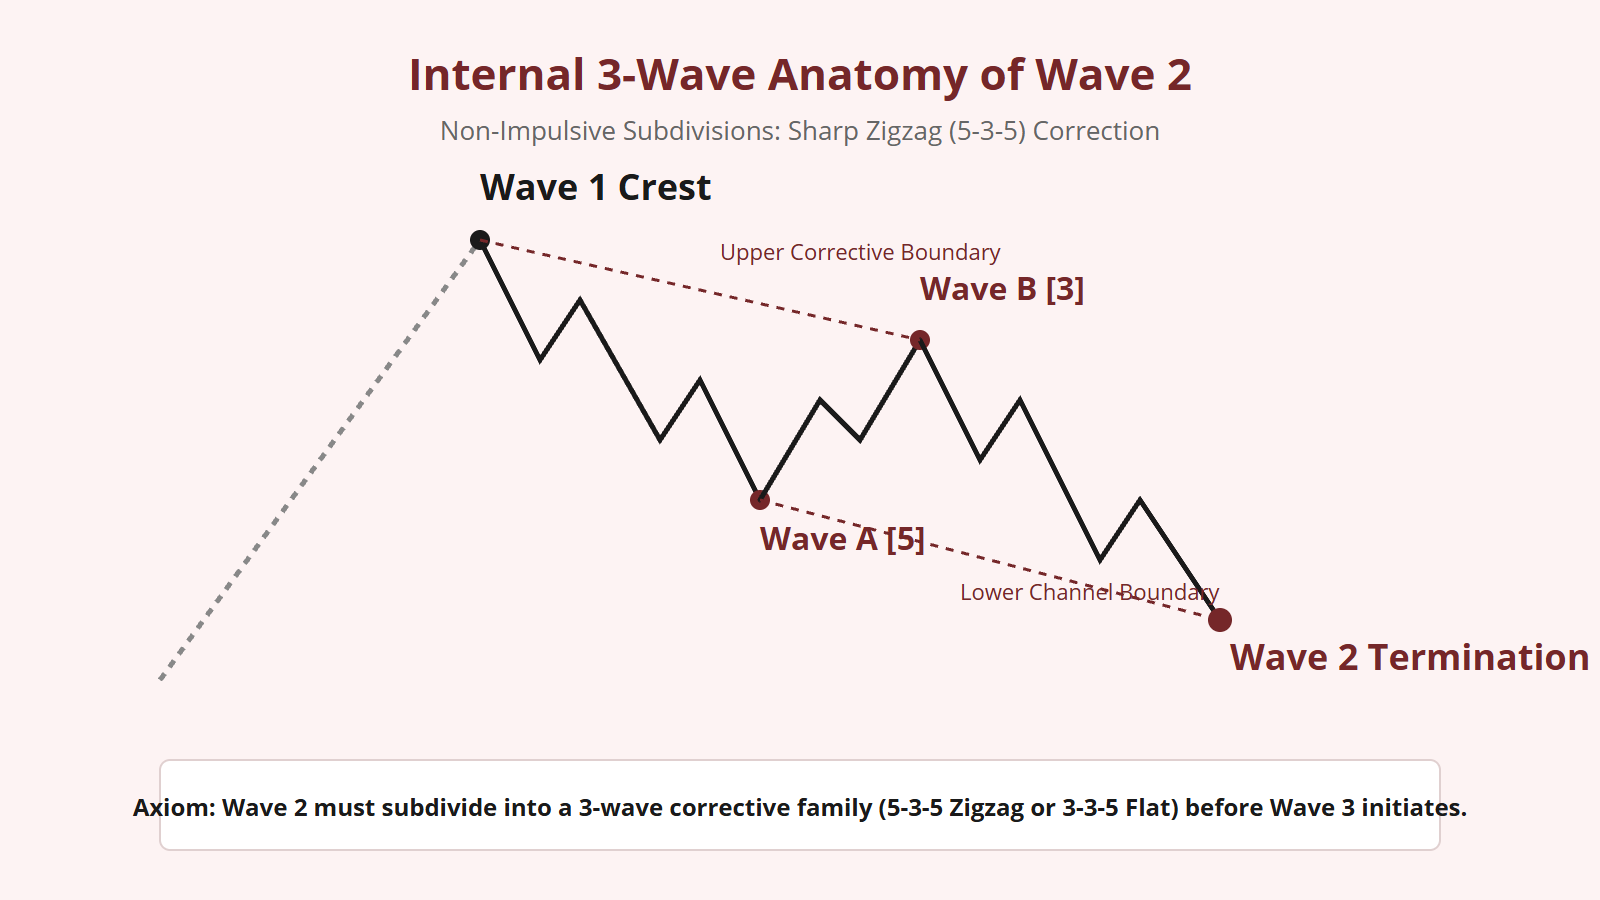
A valid Wave 2 can never be an impulse wave. It must cleanly subdivide into a recognized corrective family. In my structural tracking, Wave 2 predominantly manifests in one of two structural forms:
1. The Sharp Zigzag (5-3-5): By far the most common structure for Wave 2 (occurring roughly 75% of the time). The zigzag consists of a five-wave impulsive Wave A, a three-wave counter-move Wave B, and a terminal five-wave Wave C. The zigzag covers distance rapidly and drives directly into the 0.618 or 0.786 Fibonacci retracement zone.
2. The Sideways Flat (3-3-5): Occasionally, Wave 2 unfolds as an Expanded or Regular Flat. When Wave 2 is a Flat, Wave A subdivides into three waves, Wave B retraces near or beyond the Wave 1 peak, and Wave C terminates near the 0.382 or 0.500 level. When Wave 2 is a Flat, the Guideline of Alternation dictates that Wave 4 will almost certainly unfold as a sharp, vertical Zigzag.
Crucially, a Triangle (3-3-3-3-3) can NEVER appear as an entire Wave 2. Under the rules of wave mechanics, a standalone triangle can only occupy the penultimate wave position (Wave 4 or Wave B). If you identify a triangle developing as Wave 2, your wave count is mathematically flawed.
Execution Protocol: Mapping the Wave 2 Pivot
To accurately time the termination of Wave 2 and confirm the structural pivot, I follow a disciplined 4-step protocol:
- Calculate Fibonacci Clusters: Project the 0.500, 0.618, and 0.786 retracements of Wave 1.
- Measure Corrective Equality: Within the internal A-B-C zigzag of Wave 2, calculate the 100% projection of Wave A ($C = A$). The intersection where Wave C equals Wave A at or near the 0.618 retracement represents the prime reversal coordinate.
- Monitor Micro-Wave Completion: Verify that internal Wave C has completed five distinct sub-waves [i]-[ii]-[iii]-[iv]-[v].
- Confirm Momentum Divergence: Observe positive momentum divergence on the micro timeframe as Wave C establishes its terminal low.
When these four criteria align, the structural foundation is secure. Wave 2 has completed its mathematical obligations, the invalidation level remains pristine, and the stage is set for the most explosive phase in market geometry: Wave 3.


Leave a Reply